Appnote on Cell Analysis of T Cells
Comprehensive analysis of T Cell status following activation using a 16-color immunophenotyping panel on the Novocyte Advanteon
Abstract
T cells are an essential part of the immune response, capable of recognizing and eliminating foreign pathogens and tumor cells. However, tight control of the T cell response is necessary to prevent autoimmunity and immunopathology. A 16-color T cell immunophenotyping panel was developed for the Agilent NovoCyte Advanteon to simultaneously analyze T cell differentiation, activation, exhaustion, and functional output through degranulation and cytokine expression. This flow cytometry panel provides comprehensive analysis of T cell function in an immune response.
Authors
Lauren Jachimowicz, Ming Lei, Peifang Ye, Yan Lu, and Garret Guenther Agilent Technologies, Inc.
Introduction
The role of the immune system is to fight off pathogens while limiting autoimmunity. T cells are an important part of the adaptive immune response, capable of recognizing specific antigens and resolving infections. In a normal immune response, T cells are activated to rapidly divide and destroy all infected or cancerous cells. Activation through the T cell receptor (TCR) and costimulatory receptors must be balanced with inhibitory receptors such as programmed cell death protein 1 (PD-1), lymphocyte-activation gene 3 (LAG-3), and T cell immunoglobulin and mucin-domain containing-3 (TIM-3).This is needed to prevent the development of autoimmunity and immunopathology.
When stimulation of T cells is sustained, there is a progressive increase in the expression of inhibitory receptors and a decrease in T cell effector function and proliferative capacity (T cell
exhaustion). This can be seen during a chronic infection or cancer. Inhibitory receptors have become a focus of cancer immunotherapy research because reversing inhibitory receptor
expression through checkpoint inhibitor blockade has restored T cell function and improved tumor immunity in the clinic. The severity of T cell exhaustion correlates heavily with the co-expression of multiple inhibitory receptors, making combination therapy promising because
multiple inhibitory receptors are targeted, demonstrating an increase in tumor immunity. Analysis of T cell inhibitory receptor expression alone does not provide a comprehensive view of T cell
state. Measuring additional markers for T cell differentiation, activation, previous
antigen exposure, degranulation, and cytokine production provides a more comprehensive understanding.
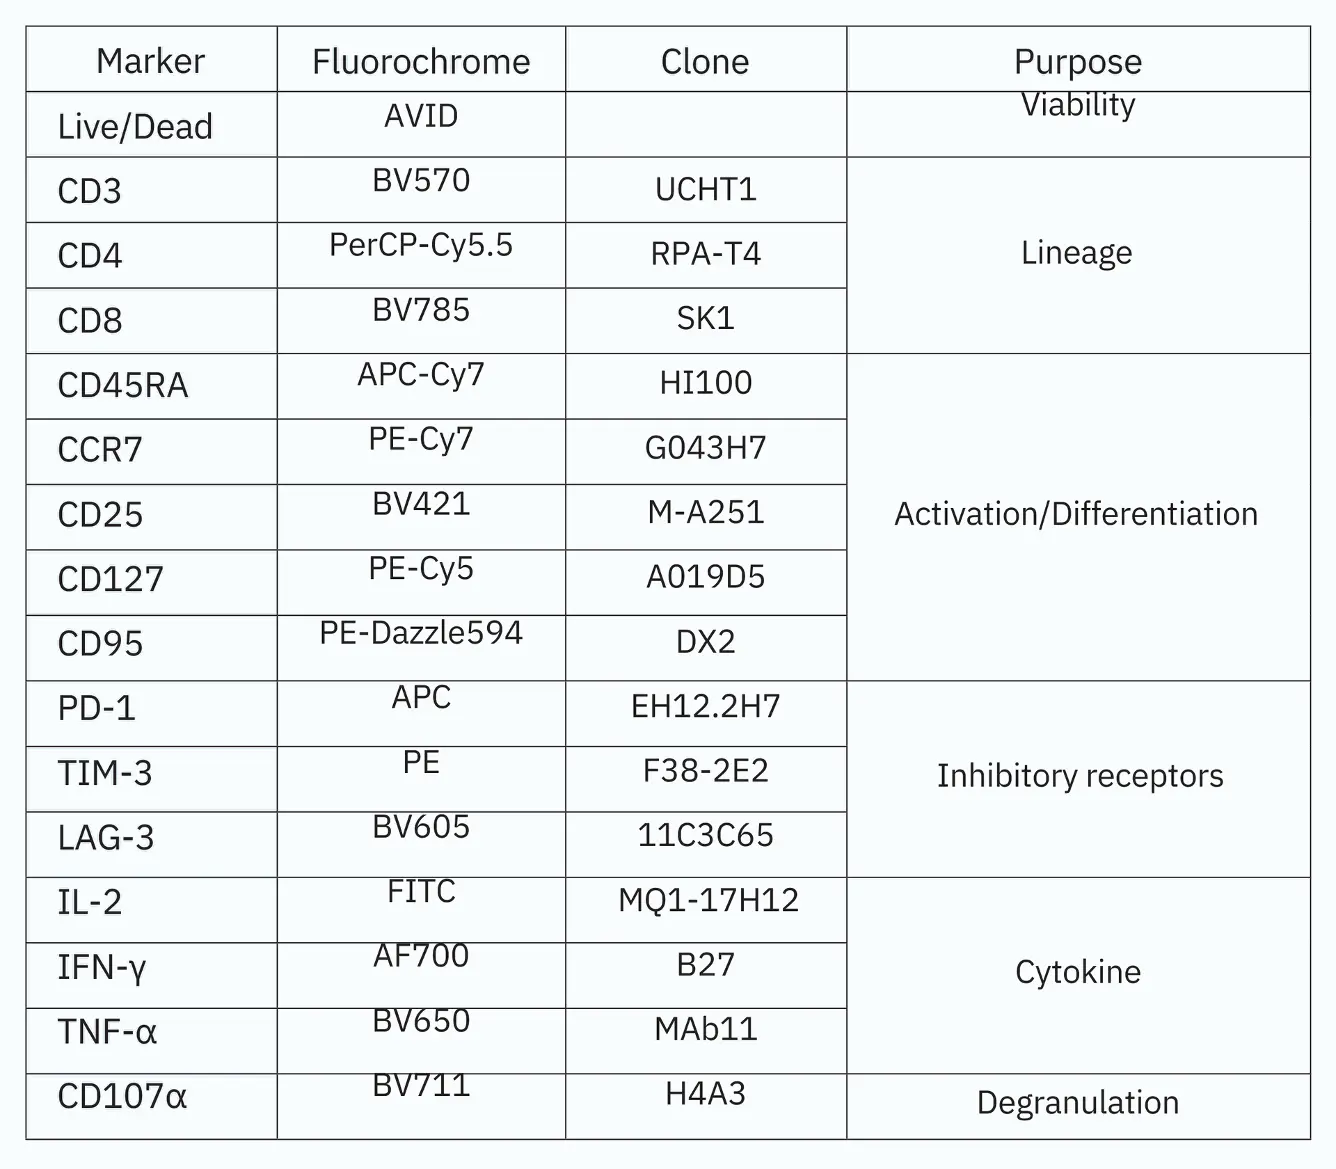
Studies have identified inherent differences in inhibitory receptor expression among naive, effector, and memory T cell subsets. A 16-color immunophenotyping panel was designed to run on the NovoCyte Advanteon (Table 1) to examine CD4 and CD8 T cell differentiation and activation state, and measure functional T cell responses. Using the NovoCyte Advanteon’s high capacity for multiparameter analysis, these data demonstrate a comprehensive look at the kinetic changes that occur in T cell subsets and function after stimulation.
In depth analysis of T cell state after TCR stimulation
To fully examine the T cell response to TCR activation, we looked at differentiation, activation, and inhibitor markers as well as degranulation and cytokine production in CD4 and CD8 T cells (Table 1). Isolated peripheral blood mononuclear cells (PBMCs) were stimulated with anti-CD3, anti-CD28 antibodies, and interleukin-2 (IL-2) to
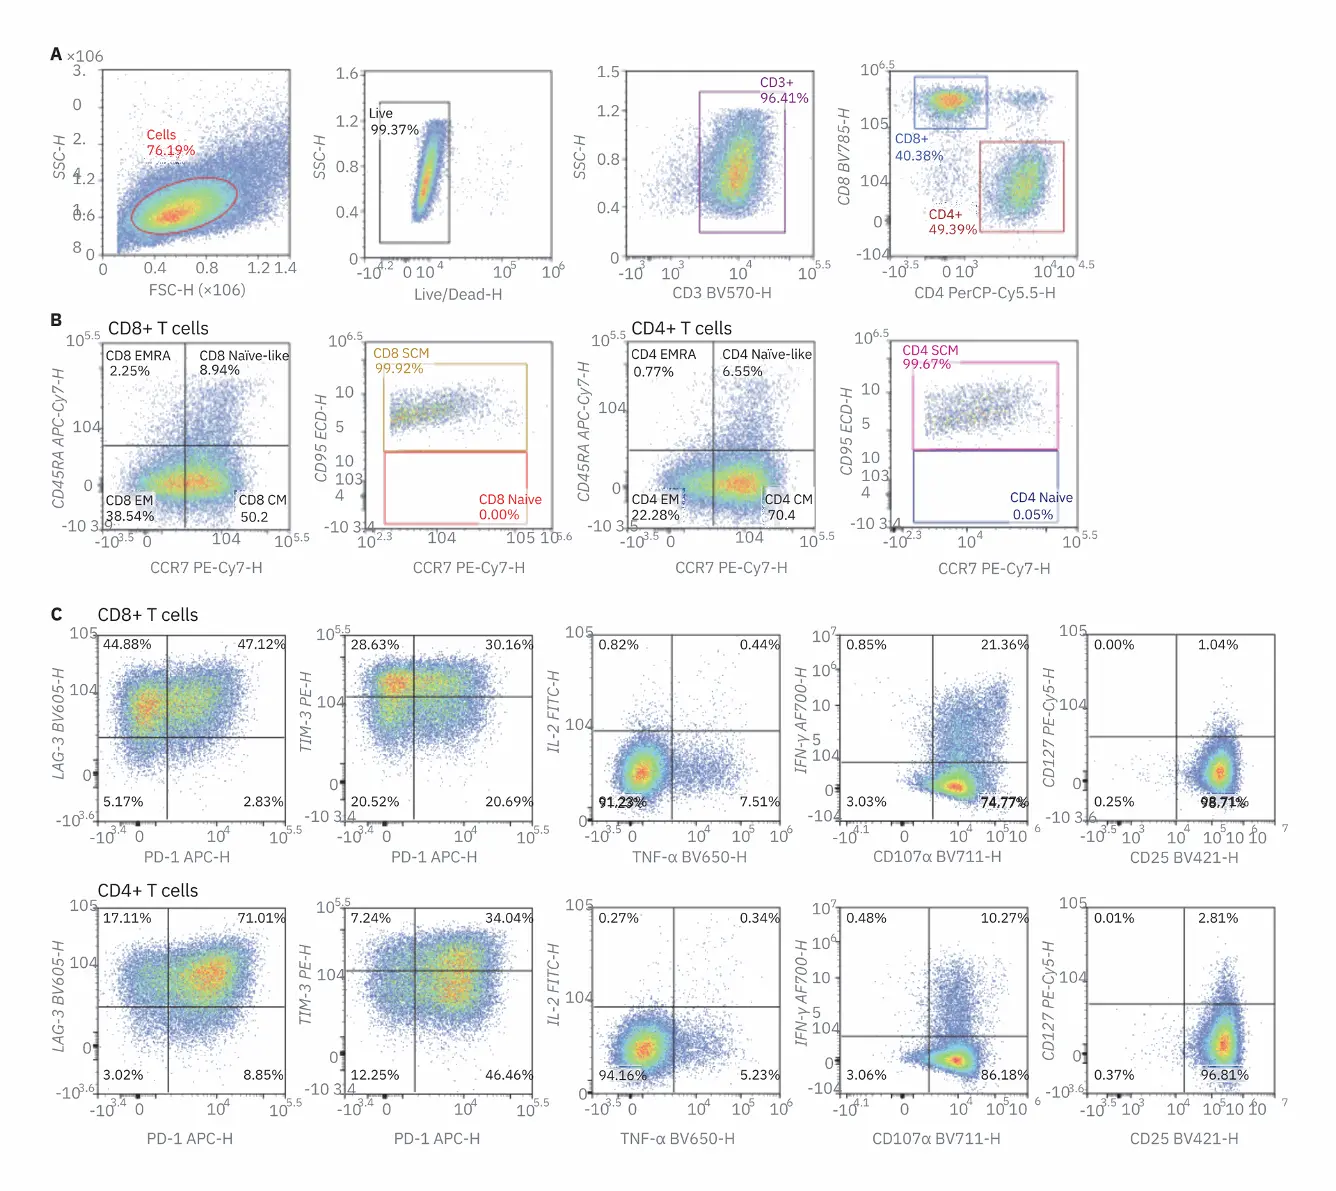
induce T cell activation. Six hours before flow cytometric analysis, cytokine secretion was blocked with a protein transport inhibitor. Samples were measured initially after two and four days in culture, and again on day 5 after being restimulated. Figure 1 demonstrates a representative gating strategy for the day 4 sample. First, dead cells were excluded using
viability dye followed by examining the frequency of CD4 and CD8 T cells within the total CD3 T cell population. Next, T cell differentiation was assessed by determining the relative frequency of T cell subsets based on surface expression of CD45RA and CCR7. T cells
are separated into Naive‑like T naive-like (CD45RA+/CCR7+), central memory T (CD45RA-/CCR7+), effector memory CM EM (CD45RA-/CCR7-), and CD45RA+
effector memory T EMRA (CD45RA+/ CCR7–). Furthermore, T
naive-like are separated into true (T memory T cells (T naive) and T stem‑cell SCM) by the expression of CD95 on T SCM.
Table 1. Fluorochromes used in the 16-color immunophenotyping panel.
Next, the expression of inhibitory receptors PD-1, TIM-3, and LAG-3 was examined as well as activation markers CD25 and CD127. These markers provide additional information on the activation state of the T cells. Finally, production of cytokines IL-2, tumor necrosis factor alpha (TNFα), and interferon gamma (IFNγ) were measured as well as degranulation by expression of CD107α, which demarcates cytolytic T cells. All gates were determined with the use of fluorescence minus one (FMO) controls (Figure 1D). Four days after stimulation, most cells had undergone T cell activation, and there were no longer any T populations. A large upregulation in CD25 expression and downregulation of CD127 was seen in T cells, also consistent with highly activated T cells. Both CD4 and CD8 T cells had upregulated inhibitory receptor expression, although not all cells had positive expression. naive cells in both the CD4 and CD8 T cell Cytokine production of TNFα and IFNγ was also present while only minimal IL-2 production was observed. Most T cells were also CD107α positive, showing that they had cytolytic potential. This high-parameter staining panel with the NovoCyte Advanteon allows extensive analysis of T cells after stimulation. Next, kinetic changes in the parameters measured were examined in T cells after TCR activation.