Products /
CytoCHECK SPAchip® pH red single detection kit
CytoCHECK SPAchip® pH red single detection Kit
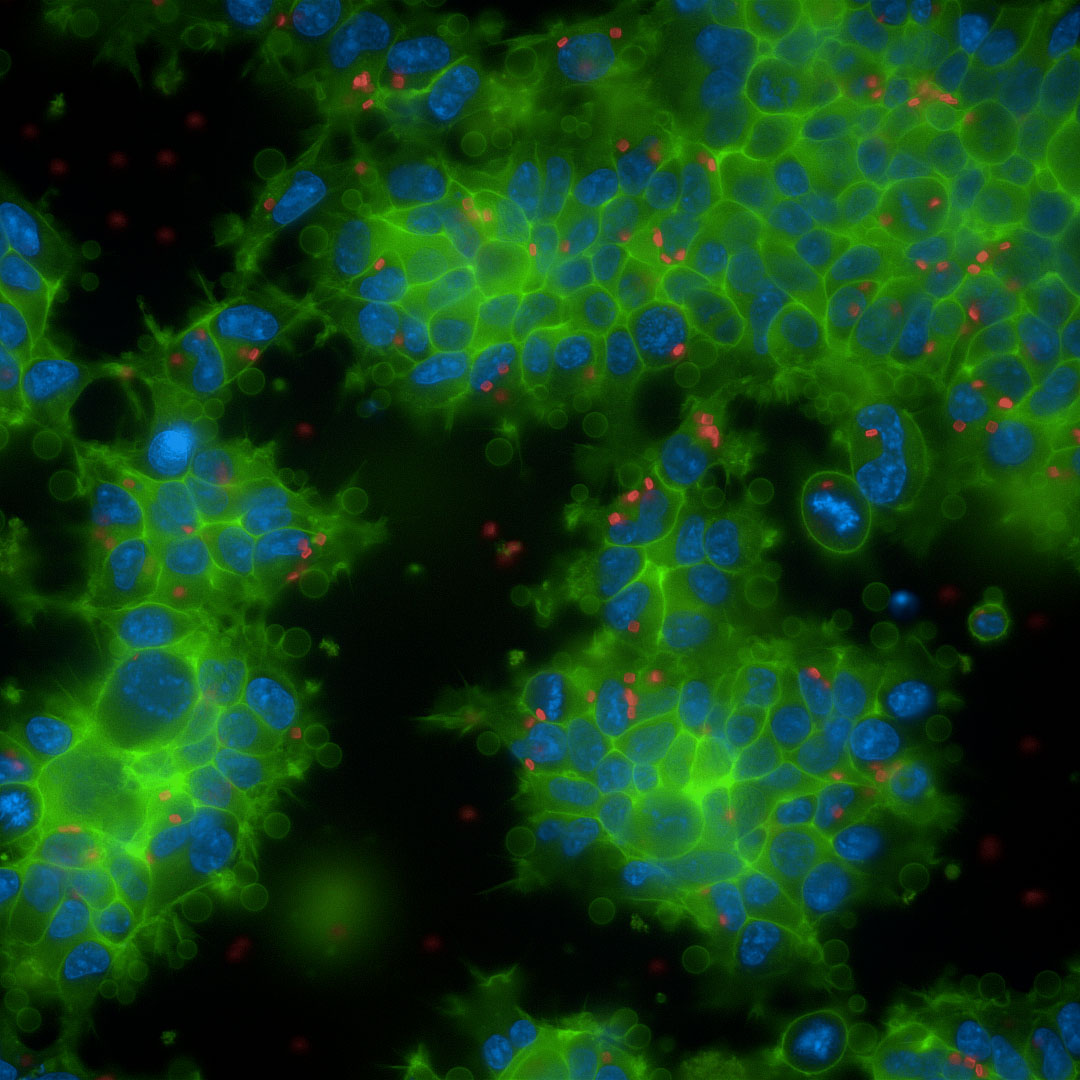
CytoCHEK SPAchip® assay kits are novel fluorescence cell- based assays developed by A4cell that brings together the fields of nanotechnology and cell biology. SPAchips are composed of fluorescently labeled silicon microparticles which can be internalized in the cytosol of cultured cells to monitor intracellular parameters for extended periods of time.
Kit box contains:
- 1 ASSAY SPAchip® eppendorf tube (Quantity: 2.5 x10^6 ASSAY SPAchip®)
- 1 Control SPAchip® eppendorf tube (Quantity: 2.5 x10^5 CONTROL SPAchip®)
- 1 buffer (Quantity: 5mL)
- Quick start guide
-
CytoCHECK SPAchip® pH RED Single-Detection Kit allows measurement of intracellular pH levels by changes in fluorescence intensity, which allows a more comprehensive study of the living single-cell physiology and maximizes the performance of most of imaging analyzers. Its signal in red makes it feasible for applications with high green autofluorescence such as organoids cultures. Moreover, due to its ratiometric behaviour signal to noise ratio is increased leading to cleaner curves.
What are the key features?
- Measures intracellular pH levels by changes in fluorescence intensity.
- Composed of fluorescently labeled silicon microparticles that can be internalized in the cytosol of cultured cells.
- Provides a more comprehensive study of single-cell physiology and metabolism.
- Maximizes the performance of most imaging analyzers.
- Non-invasive and allows long-term monitoring of intracellular pH changes.
Technical specifications
| Amount | ~2.5 millions of SPAchips |
| Applications | Cell Viability, proliferation, cell image acquisition |
| Assay Time | 30 minutes |
| Assay type | Living single-cell based |
| Detection method | Red Fluorescence |
| Fluorescence | λex: 546 nm; λem: 610 and 707 nm. |
| For research use only | Not for use in diagnostic procedures |
| Incubation time | Overnight |
| Measuring range | pH 4.5 – 9.0 |
| Platform | Fluorescence microscopy, HCS/HCA platforms and flow cytometry |
| Sample type | Adherent cells, suspension cells |
| Shelf Life | 6 months upon arrival |
| Shipping | Environmental conditions |
| Solubility | Soluble in assay buffer (aqueous) |
| State | Solid-phase film with embedded SPAchips |
| Storage Conditions | Refrigerate upon arrival (2ºC to 8ºC) and protect from light |
Imaging and fluorescence signal analysis
SPAchip® kits are designed to dynamically shift fluorescence intensity values in response to intracellular changes in analyte concentration. Fluorescence intensity is measured by exciting the live cell sample at 546 nm and detecting fluorescence emission at 610 and 707 nm. Normalization of fluorescence intensity values collected at both emission wavelengths provide a ratiometric behavior that allows a more precise quantification of intracellular pH. Relative intensity units depend on the instrumental setup (excitation power, detector efficiency, etc). To obtain quantitative data, a calibration curve needs to be analyzed in the same run. Data acquisition can be adapted to fluorescence microscopy and flow cytometry. Additional detection channels, such as brightfield, phase contrast, FSC or SSC, are suggested to better identify individual SPAchips.
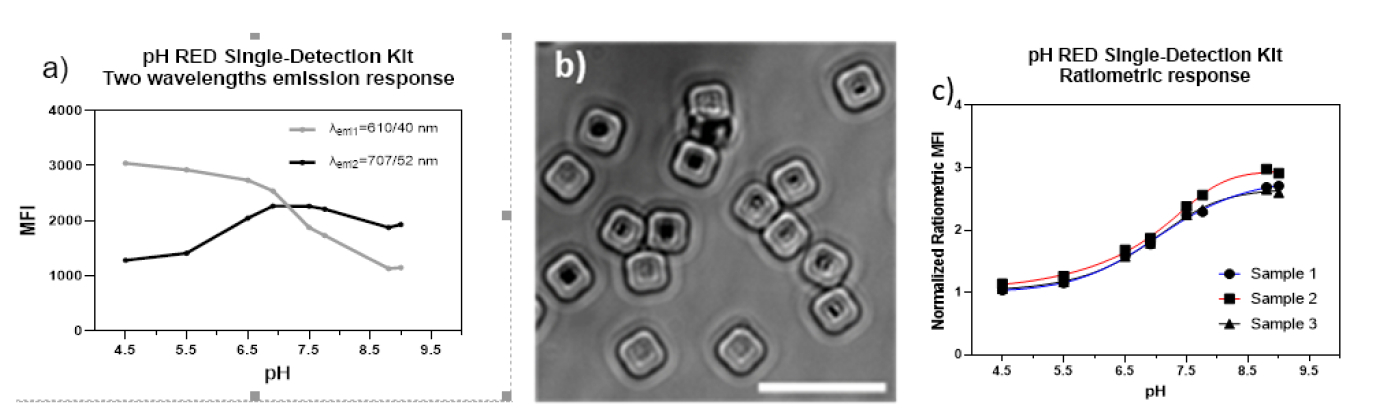
CytoCHECK SPAchip® RED pH Single Detection at different pH conditions using commercial calibrators. a) Graph showing emission signal at two different wavelengths for pH 4.5 – 9.0. b) Brightfield image of SPAchips® once in solution (Image from Torras et al. 2015 DOI: 10.1002/adma.201504164), Scale bar = 10 µm. c) Graph showing ratiometric normalized fluorescence intensity values at different pH. Ratiometric values were obtained by dividing λemi2/ λemi1 emission signals in HCS-Operetta equipment with the excitation in the range λexc=545/15 nm.
SPAchip® fluorescence signal quantification can be adapted to any analysis image software. Object segmentation should be performed to identify SPAchips inside cellular region to every sample. Fluorescence intensity units can be exported as a spreadsheet to plot graphical summaries of the results. Quantitative data need to be interpolated from the calibration curve values to each experiment. Normalization of results to experimental controls offer a semi-quantitative approach.
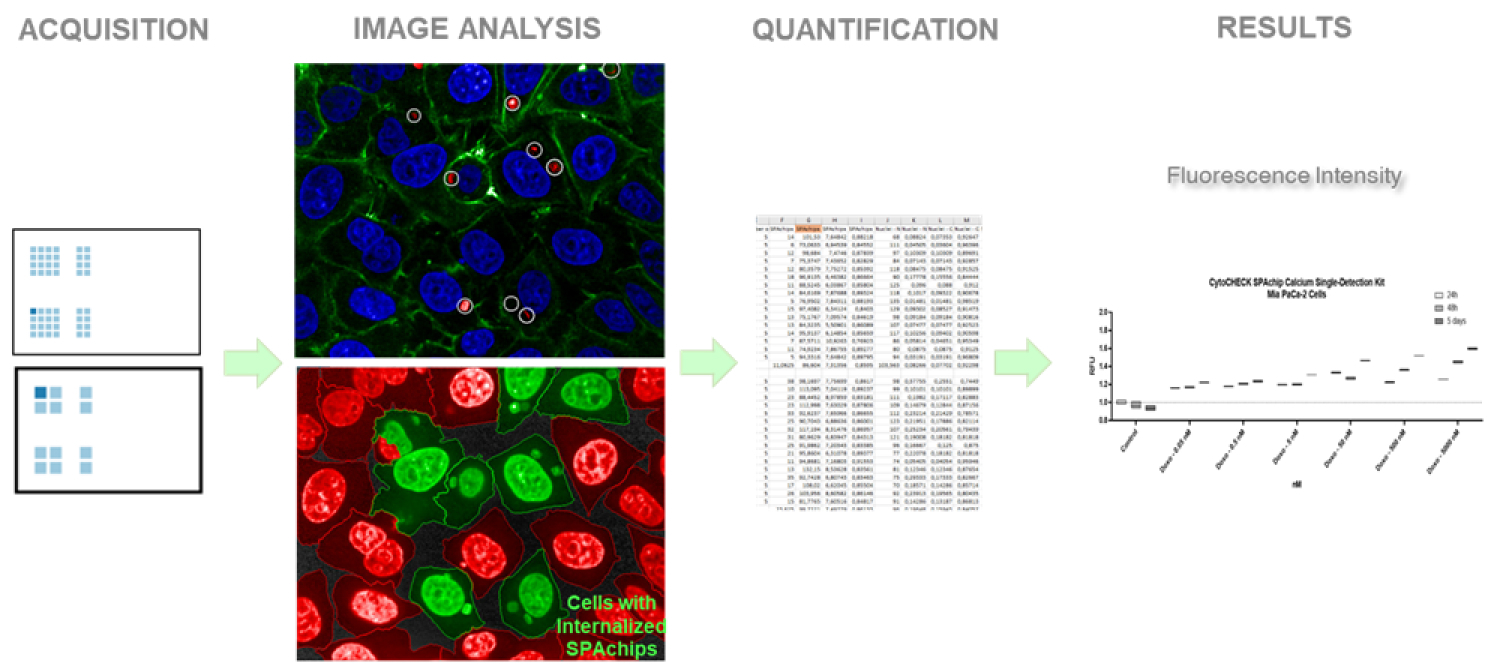
Text High Image Analysis Workflow. From sample data acquisition to object identification, quantification and result presentation.
Supported by


What would you use SPAchip® technology for?
Tell us and help understanding and developing our product