Appnote Cell Analysis
A 30-color Immunophenotyping Panel of Mice Infected with Influenza Using the Agilent Novocyte Penteon Flow Cytometer
Abstract
Use of flow cytometry has become routine across scientific disciplines, encompassing both the basic and clinical research spaces. It has proven to be a powerful tool to analyze different subpopulations of immune cells and gather a comprehensive overview of the immune system. Due to great advancements within the field, newer flow cytometers can support multiple colors, enabling identification of a variety of cells simultaneously. In this application note, a 30-color immunophenotyping panel was designed for the five-laser Agilent NovoCyte Penteon flow cytometer to see the distribution of immune cells in the lung, spleen, and mediastinal lymph nodes of mice infected with influenza.
Authors
Dimitri Popoff and Cyrille Mionnet Centre d’Immunologie Marseille Luminy, France
Camille Santa Maria and
Alejandra Felix
Agilent Technologies, Inc.
Introduction
Complex and sophisticated multicolor flow cytometry experiments capable of evaluating multiple immune cells simultaneously are increasingly accessible thanks to key improvements in the field. Keeping pace with advancements, the Novocyte Penteon is equipped with five lasers (UV, 349 nm; violet, 405 nm; blue, 488 nm; yellow-green, 561 nm; and red, 637 nm) and 30 fluorescence detectors to gain the most information possible from one biological sample. With 30 colors, it is possible to identify multiple subpopulations in one tube with a single acquisition.
In this panel designed at the Centre d’Immunologie Marseille
Luminy (CIML), all detectors are used to delve into the
immune system of an influenza infected mouse and obtain
a comprehensive overview of immune cell subpopulations
post-infection. The 30-color immunophenotyping panel was
designed through diligent fluorophore selection considering
expression markers, fluorescence intensity, spectral overlap,
and Agilent NovoCyte Penteon configuration. Resulting data
was analyzed using NovoExpress software and revealed a
difference in cell distribution across three lymphoid organs.
Experimental
Materials
–RPMI-1640 Medium (GIBCO, 21875034) –Fetal Calf Serum, FCS (Biowest, S1810-500) –DNAse I (Sigma-aldrich, 10104159001) –Collagenase II (Sigma-aldrich, C5138) –UltraPure 0.5 M EDTA, pH 8 (Invitrogen, 15575-038) –1X RBC Lysis Buffer (eBioscience, 00-4333-57) –FACS Buffer (PBS 1x, 0.5% BSA, 2 mM EDTA) –Brilliant stain buffer (Becton Dickinson, 563794) –Flow cytometry antibodies (Table 1) –Agilent NovoExpress Software –Agilent Novocyte Penteon flow cytometer All work was conducted on a C57Bl6 mouse, infected at
8 weeks by 5 PFU of influenza (PR8, H1N1). The mouse
was euthanized 35 days post infection. Spleen, lungs, and
mediastinal lymph nodes were extracted. A pulmonary lavage
was conducted with 10 mL of PBS 1x.
Lung and spleen: 1.Add the organ to 3 mL of RPMI 5% FCS containing 45 µL
of DNase I (150 µg/mL) and 30 µL of collagenase II (500 µg/mL).
2.Dissociate the organ tissue with OctoGentleMacs
(Miltenyi) using the "m_lung-01_02" program.
3.Wait 30 minutes at 37 °C. Run the "m_lung-01_02" program again on OctoGentleMacs (Miltenyi).
4.Add 30 µL of EDTA (0.5 M) and wait 2 minutes. 5.Filter with a cell strainer (70 µm). 6.Add media until the total volume is 15 mL. 7.Centrifuge for 7 minutes at 4 °C, 400 g. 8.Aspirate the supernatant. 9.Resuspend the pellet with 3 mL of RBC and wait
5 minutes.
10. Add media until total volume is 15 mL. 11. Centrifuge for 7 minutes at 4 °C, 400 g. 12. Resuspend in 500 µL of FACS Buffer containing 10% Fc
Block + 20% Brilliant Stain Buffer. Keep on ice.
Lymph nodes 1.Dissociate manually. 2.Filter with a cell strainer (70 µm). 3.Add media until the total volume is 15 mL. 4.Pellet the cells by centrifugation for 7 minutes
(400 g at 4 °C).
5.Resuspend the pellet in 200 µL of FACS Buffer containing 10% Fc Block + 20% Brilliant Stain Buffer. Keep on ice.
After 10 minutes on ice, count 3 million cells. Pellet cells by centrifugation for 7 minutes (400 g at 4 °C). Resuspend each sample with 50 µL of antibody cocktail (Table 1). Incubate for 30 minutes at 37 °C in the dark. Add 150 µL of FACS Buffer. Pellet the cells by centrifugation for 7 minutes (400 g at 4 °C). Rinse the cells with 200 μL of PBS.
Organ preparation
Sample preparation
Pellet the cells by centrifugation for 7 minutes (400 g at 4 °C).
Resuspend the cells in 100 µL of Live Dead Fixable
blue (diluate at 1/1,000 in PBS) for 15 minutes at room
temperature (RT) in the dark.
10. Add 150 µL of FACS Buffer. 11. Pellet the cells by centrifugation for 7 minutes
(400 g at 4 °C).
12. Acquire the samples on a NovoCyte Penteon
flow cytometer.
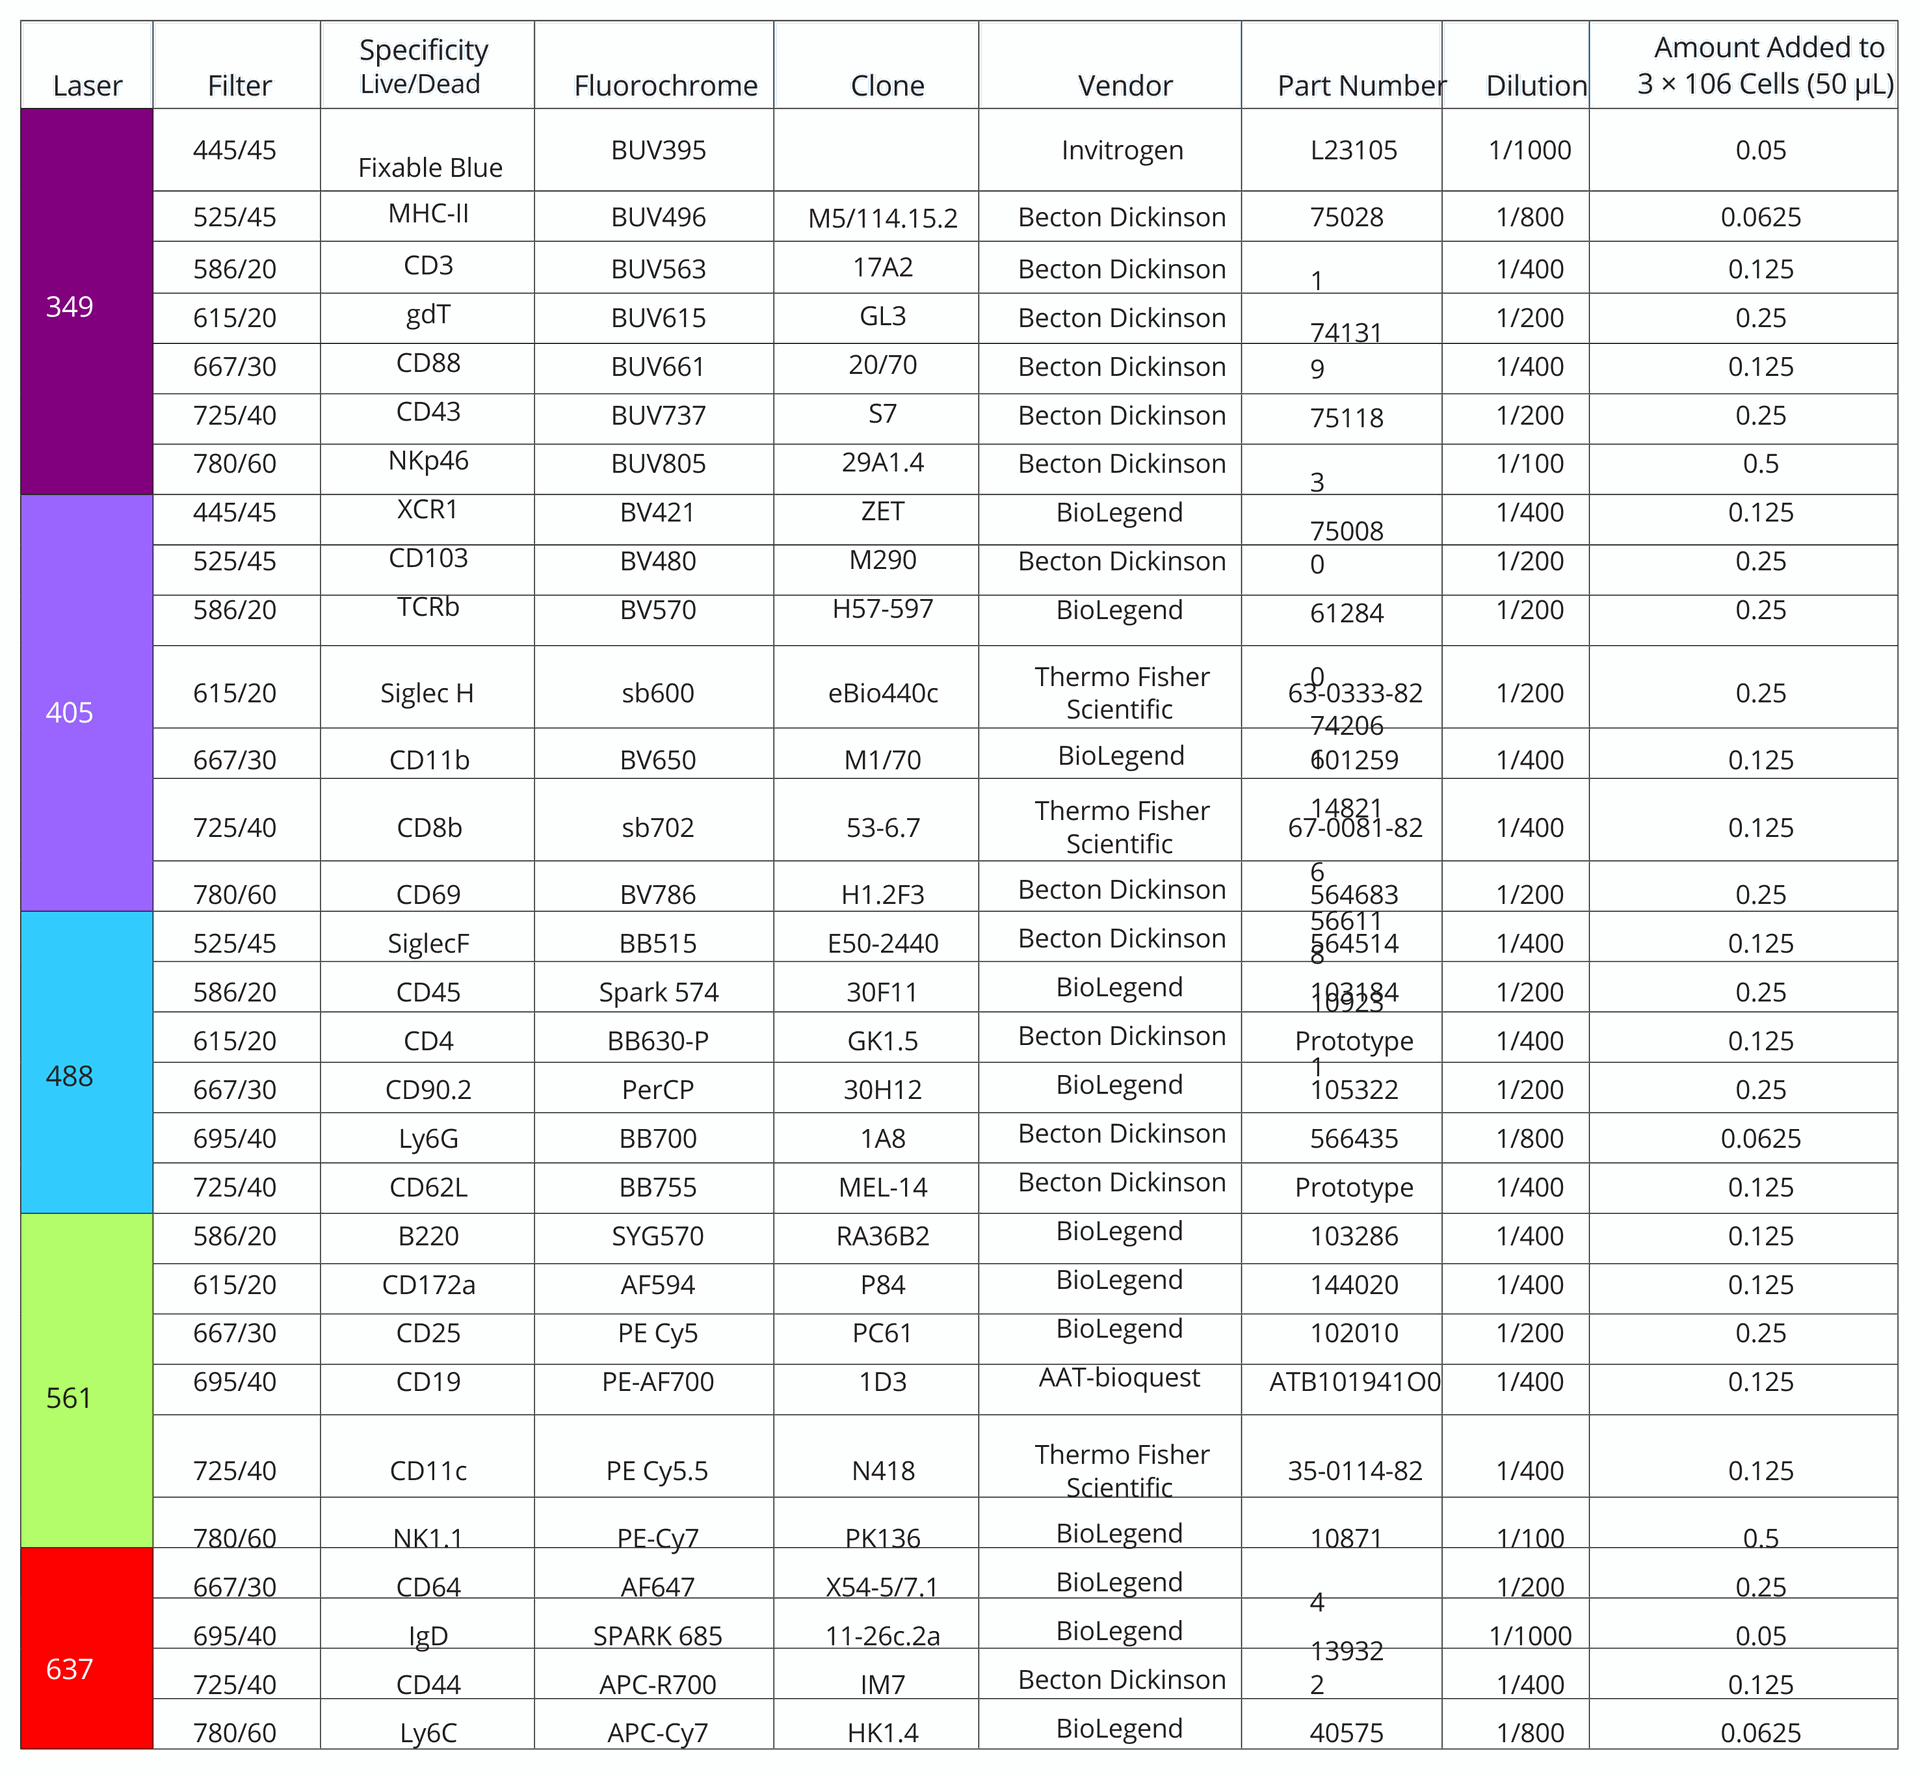
Table 1. Antibodies used in 30-color immunophenotyping panel on the Agilent NovoCyte Penteon Flow Cytometer, ordered by channels. The laser and filter used for detection for each antibody can be found in the table, as well as concentration and product details for each antibody.
Results and discussion
Flow cytometry has long been established as the gold standard to analyze heterogenous cell mixtures in both basic research and clinical applications. Newer, more sophisticated instruments with increased channels and lasers build upon their predecessors and expand the breadth of capabilities in lab and the clinic. By increasing the number of lasers and detectors, more antibodies can be included in a panel to identify target populations more precisely by their phenotypic markers. Immunophenotyping labels cells with fluorescent antibodies directed against cell surface markers, enabling visualization by flow cytometry. Design of a 30-color immunophenotyping panel maximizes throughput on a 30-detector instrument—to date the maximum number of detectors on a single flow cytometer.
The main objective of the panel design described in this
study was to evaluate the distribution of immune cells in
an influenza-infected mouse. Specifically, the distribution
of immune cell types across three lymphoid organs was
analyzed: lung, spleen, and lymph nodes. The subpopulations
of T cell types were also closely monitored to compare
differences in distribution across the three organs during
influenza infection. The same gating strategy was used
across all three organs to easily compare the data. Antibody
clone, detection channel, vendor information, and the amount
of each antibody added are described in Table 1.
The 30-color flow cytometry panel used in this application note identified several immune cell types across three organs by expression of cell surface receptors, as well as T cell activation status. To generate the panel, 50 µL of the antibody cocktail was added to 3 million cells. After staining, the sample data was acquired and analyzed using the NovoCyte Penteon flow cytometer and NovoExpress software. The gating hierarchy used to identify immune cell populations and subsets is described in the following paragraphs.
Initial gating with forward scatter (FSC) and side scatter (SSC)
removed debris to identify the cell population of interest.
Doublets were removed following FSC-A and FSC-H gating,
and live cells were then identified by Live/Dead Fixed Blue
Dead Cell Stain kit and carried forward for further analysis.
Hematopoietic cells were identified by expression of CD45+
and analyzed further, while low expression indicated the
presence of basophils. CD45+ cells were gated using CD19
and MHC II, which revealed a subset of B cells at high
expressions of both. B cells were gated further with IgD and
B220, which indicated approximately 61.39% of the B cells
were naïve.
Cells lacking expression of CD19 were segmented with markers for CD11b and Ly6G. High expression of CD11b and Ly6G determined that 6.23% of cells identified were neutrophils, while the rest were not. By maintaining gating for CD11b, but changing the Y axis to Siglec F, alveolar macrophages (high Siglec F, low CD11b) and eosinophils (high Siglec F, high CD11b) were identified. The population of cells with little to no expression of Siglec F were pushed forward for further dissection, as T cells contain very low levels of Siglec F.
To differentiate between T cells and others, gating for CD3+
and CD90+ was applied. CD3+CD90+ cells were then used
to closely analyze T cell subsets. CD3-CD90- cells were
further characterized to determine the remaining immune cell
composition
NK cells were identified by gating for expression of NK1.1 and NKp46. Cells with low expression were not considered NK cells and gated against Siglec H and B220 to identify plasmacytoid dendritic cells. The rest of the cells were plotted against CD43 and Ly6C to identify monocytes. Cells not categorized as monocytes were then gated for CD88+ and CD64+ to find macrophages, which were further confirmed by gating against MHC II and CD11c. CD8-CD64- cells were similarly gated to identify dendritic cells, which populated the upper right corner of the plot. It was possible to distinguish between the two types of conventional dendritic cells, cDC1 and cDC2 by gating for XCR1, a chemokine receptor exclusively on cDC1.
T cells (CD3+CD90+ cells) were explored in further depth
than the other immune cell populations, as the objective was
to gather insight to their activation status and distribution
across the three lymphoid organs during infection.
Approximately 3.3% of the identified T cells expressed the
gamma delta receptor. The rest were gated for expression of
CD4 and CD8, then divided into two groups: CD4+CD8– and
CD8+CD4–. Gating CD4+CD8– cells for CD25 determined
less than 2% were regulatory T cells (1.66%). The rest were
gated for CD62L+ and CD44+ to distinguish between naïve
CD4+ memory cells (CD62L+) and activated CD4+ cells
(CD62L–). Resident memory T cells (Trm) were then identified
by expression of CD103+CD69. CD8+CD4- cells followed a
similar gating strategy to distinguish between CD8+ memory
(CD44+CD62L+), activated (CD44+CD62L–), and Trm
(CD103+CD69+) cells.
While Figure 1 shows data pertaining to the lung sample specifically, it is relevant across all organs, given the same strategy was used. This was done so it was easy to compare immune cell distribution and activation across all three organs. Comparison of immune cell subpopulation frequencies in the three organs revealed marked differences in distribution in some instances (Figure 2). In this study, the frequency value was the percentage parent, which refers to the percentage of the subpopulation within the population from which it comes.
A direct comparison T cell distribution across the three
organs showed there was increased T cell expression in
the lymph nodes (90%) compared to the lungs (62%) and
the spleen (54%). CD8 T cells followed a similar distribution
pattern, though much less drastic (54% vs 43%). Interestingly,
the pattern changes remarkably. Neutrophils were also
greatly reduced in the lymph nodes relative to the lungs and
spleen (1:10:20 ratio, respectively.) Meanwhile, pDC cells
had increased distribution in the lymph nodes with minimal presence in the lungs and none in the spleen. Basophils, as expected, were minimally represented in all three organs, though there was a slight uptick in distribution in the lungs relative to the other two (0.32% versus 0.01%). With 30 parameters, it is easy to have a quick overview of the organs, with a single acquisition.
determined by NovoExpress Software during acquisition.
Figure 3 shows the absolute count of T cell subpopulations in
the lung of the infected mouse. A close look at the distribution
of T cells in the lung revealed the highest concentration—
measured as events per microliter—consisted of activated
CD4+ and CD8+ cells. Though not quite 1:1, the distribution
between the two did not differ greatly. The next set of most
common T cells were much less frequent. Interestingly, CD8+
Trm cells were an order of magnitude more frequent than
CD4+ Trm cells.
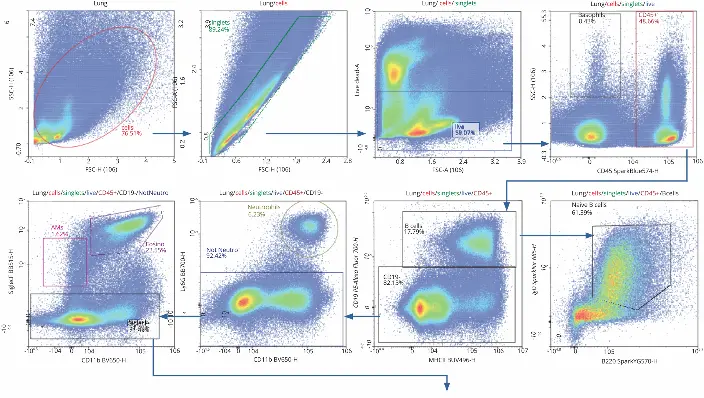
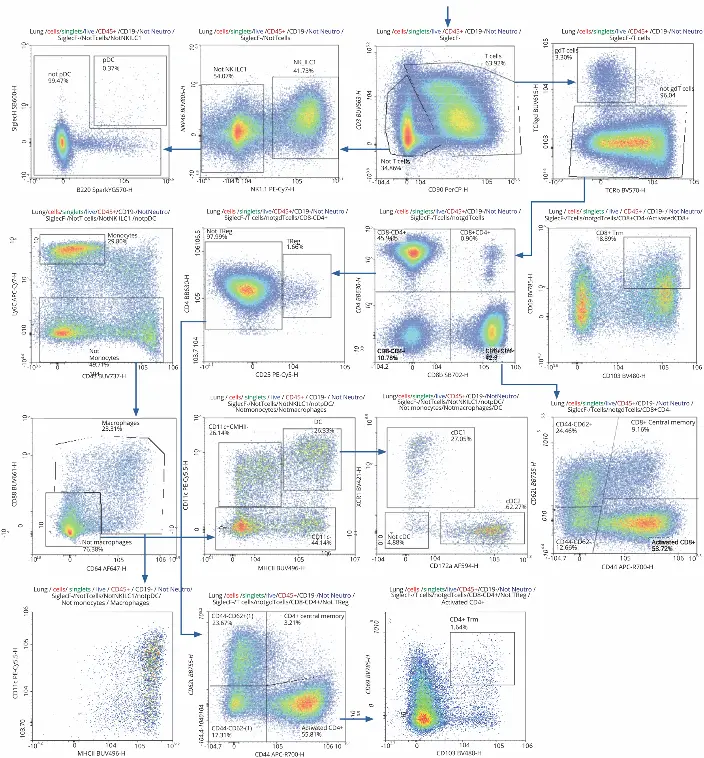
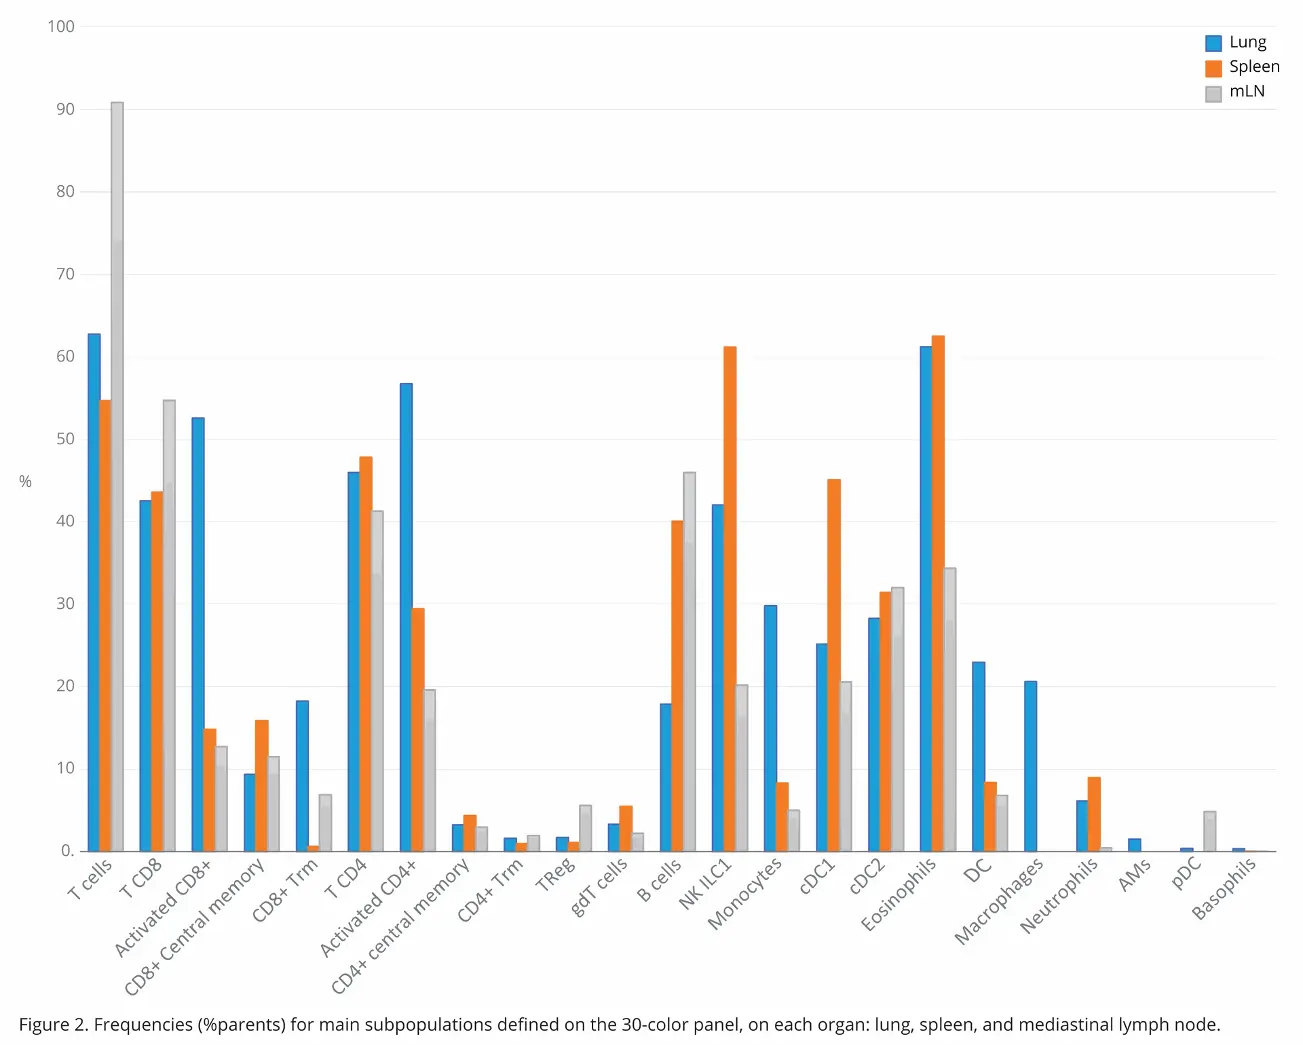
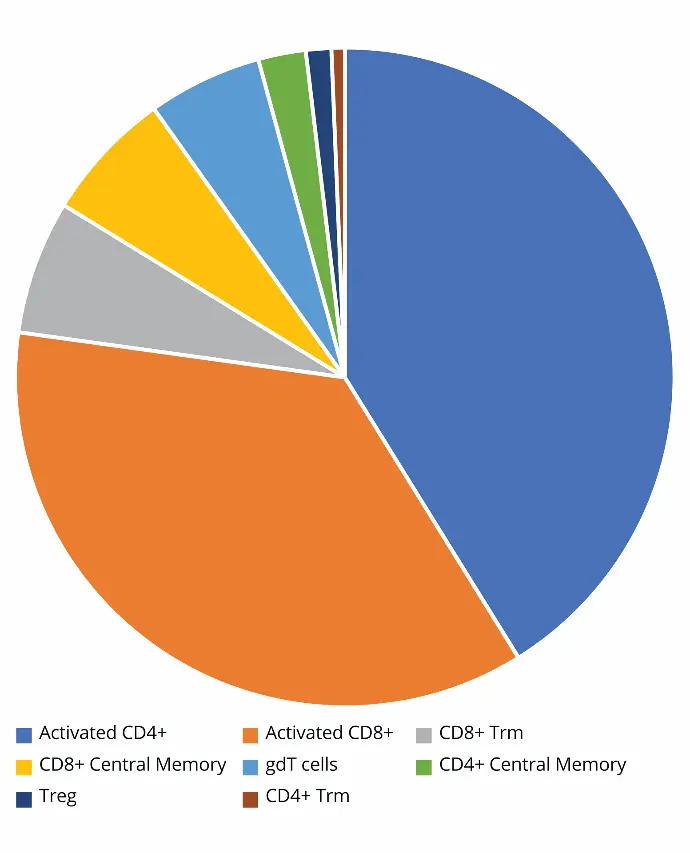
Figure 3. T cell subpopulation distribution according to their concentration (events/µL) in lung.
Conclusion
The Agilent NovoCyte Penteon flow cytometer enables
researchers to study multiple important parameters in one
acquisition—a great asset in immunophenotyping. With
five lasers and 30 detectors, it is possible to extract more
information from a single tube, saving precious biological
material. Absolute count provides even more information
about the sample. In this application note, the same gating
strategy was applied on three lymphoid organs, permitting
comparison of T cell distribution and allowing insight into
the immune system during influenza infection. The high
detection capabilities of the NovoCyte Penteon also allowed
identification of other immune cell subsets in the lung, spleen,
and lymph nodes in the same experiment