Application Note
Extensive Assessment of Cytokine
Production Following Immune Cell
Stimulation on the NovoCyte Penteon
using the LEGENDplex Bead-based
Multiplex Assay
Abstract
Cytokines are small molecules essential for immune cell response to activation by
pathogens, autoimmunity, or therapeutics. Measuring cytokine production and the
source of cytokine production is important for an in-depth understanding of the
immune response in primary samples, such as from pathogenic infections, or novel
therapeutics to ensure unintended cytokine responses do not occur. The Biolegend
LEGENDplex COVID-19 Cytokine Storm Panel 1 and 2 run on the Agilent Penteon
flow cytometer was used to quantify the secretion of 27 cytokines, providing an
in-depth snapshot of the cytokine response. Intracellular cytokine staining using
flow cytometry provided additional information to determine the frequency of
cytokine-producing cells and identify the cell populations producing cytokines. Using
both bead-based cytokine production quantification and intracellular cytokine assays
provides a deeper understanding of the cytokine response by immune cells
Author
Lauren Jachimowicz and
Garret Guenther
Agilent Technologies, Inc.
Introduction Cytokines are small proteins acting as soluble messengers, which are responsible for communication between nearby cells. Signaling by cytokines can modulate gene regulation, innate and adaptive immune response, and inflammation. Cytokine storm syndrome is a life-threatening inflammatory response involving rapid, uninhibited overproduction of cytokines and related molecules leading to hyperactivation of the immune system. Cytokine storm syndrome can be triggered by various therapies, cancers, and pathogens including COVID-19, resulting in systemic inflammation, acute respiratory distress (ARDS), and multi-organ damage. COVID-19 induced cytokine storm holds a central role in the severity of the disease, suggesting that the virusinduced inflammatory response is what determines the most severe COVID-19 symptoms. Investigations have shown increases of several cytokines in severe COVID-19 patients including IL-1β , IL-1RA, IL6, IL-7, IL8, IL9, IL10, basic FGF, GCSF, GMCSF, IFNγ, CXCL10, MCP1, MIP1A, MIP1B, PDGF, TNFα, and VEGF. In turn, IL-1β and IL-6 are being investigated for potential therapeutic targets for the treatment of COVID-19. Outside of COVID-19, cytokine production has been shown to determine the severity of many other pathogenic infections, and the identification, as well as quantification, of cytokines produced in biological samples can elucidate the complexity of a viralinduced immune response. Cytokine production can be measured directly by quantifying the amount of cytokine protein using analyte-specific antibodies. The most common and least expensive method used for cytokine measurement is the enzyme-linked immunosorbent assay (ELISA). In this process, an analyte-specific antibody is used to immobilize the cytokine to a solid surface and is then complexed with an
antibody linked to an enzyme providing
a readout. The readout can be used
to determine the concentration of the
cytokine in the sample. However, each
ELISA is limited to one analyte, restricting
the total number of cytokines that can be
measured simultaneously. Array-based
cytokine measurements can measure
many cytokines at the same time, but
offer only qualitative information on
the presence/absence of a cytokine
and require specialized equipment to
perform. On the other hand, bead-based,
multiplex flow cytometry assays follow
similar principles as an ELISA, but the
reaction occurs on a bead instead of a
plate. Using easily distinguished beads,
this assay allows the simultaneous
assessment of many cytokines, providing
accurate quantification of cytokine
concentrations with high detection
sensitivity, and a broader dynamic range
than traditional methods. All of these
assays quantify the amount of secreted
cytokine produced; however, it can be
useful to determine which cells are
responsible for secreting which cytokine.
Intracellular cytokine staining can
detect the specific cytokines produced
in different cell types with the use of
cell surface markers. Determining the
concentration of secreted cytokine,
as well as the cell type producing said
cytokine, provides important information
on the immune cell response to stimuli.
Due to the clinical results of CD28
superagonist monoclonal antibody
(TGN 1412), which resulted in severe
cytokine storm syndrome development,
the cytokine release assay has
become routine for screening novel
therapeutics under investigation. It is
primarily used to assess the risk of
developing inflammatory responses
to new agents. Individual labs may
differ in their approach to the cytokine
release assay, but all are measuring
immune cell activation by stimulation
that results in cytokine secretion.
Positive controls are known cytokine
release syndrome stimulants, such as
CD3-OKT3 antibody, lipopolysaccharide,
TGN1412, or mitogens, such as PMA.
Most of the cytokine release assays
performed focus on three to 12 different
cytokines, primarily released from
T cells or NK cells, while most assays
detect three of the four common
cytokines, interferon-γ (IFN-γ), tumor
necrosis factor-α (TNFα), interleukin-6
(IL-6) and interleukin-8 (IL-8). Some
laboratories extend this panel by
including IL-1β, IL-2, IL-5, IL-10, IL-12,
or IL-17. Having a targeted panel of just
of few cytokines can be effective when
you know which cell is most likely to be
stimulated with the therapeutic being
investigated; however, a positive cytokine
response would potentially be missed
in cells types other than T and NK cells,
since most cytokines assessed are
specifically produced by T or NK cells.
Also, performing ELISA assays on many
samples can be a time-consuming and
labor-intensive process. An assay that
can quantify the production of a large
number of cytokines simultaneously,
while providing a fast and easy workflow,
will allow for the easier discovery of new
and unpredicted cytokine responses
in both pathogenic infections and
responses to novel therapeutics.
In this application note, two immune
stimulators, αCD3 antibody or LPS, were
used to activate PBMC from two donors.
Cytokine production was measured
for 27 different cytokines using the
BioLegend LEGENDplex COVID-19
Cytokine Storm Panel 1 and 2, which
measure 14 cytokines and 13 cytokines,
respectively. The LEGENDplex COVID-19
Cytokine Storm Panel detection kits
contain different concentrations of
APC fluorescent-encoded capture
beads in two sizes. Capture beads
are conjugated with an antibody
specific for each cytokine and can be
segregated into an analyte-specific
population by the combination of size
and APC fluorescence. When combined
with a sample containing the target
cytokine, each analyte will bind
to its specific capture bead and,
using a similar principle to the
sandwich-immunoassay, biotinylated
detection antibody cocktail is added
followed by streptavidin-phycoerythrin
(SA-PE) so that the PE signal provides
a fluorescent readout to determine
the cytokine concentration. This assay
allows for the simultaneous assessment
of up to 14 cytokines in one well, saving
sample and time. It also provides a
higher detection sensitivity and broader
dynamic range than traditional methods.
For the examples we show here,
flow cytometric intracellular cytokine
staining was coupled with cell surface
markers to determine the cell population
responsible for key cytokines IL-2, IFN-γ,
and TNFα. Intracellular cytokine staining
can show which cell is responsible for
producing specific cytokines and is
essential in determining which cells to
target when trying to mediate a cytokine
storm response. Using the secreted
cytokine production assessment
with the LEGENDplex assays (in
conjugation with intracellular staining) on
Agilent NovoCyte flow cytometers means
that more information can be obtained in
a single experiment on the quantity and
nature of cytokines produced.
Materials and methods
Reagents
– Ficoll-Paque PLUS
(Millipore Sigma GE17-1440-02)
– Human IgG control antibody
(R&D Systems 1-001-A)
– αCD3 antibody Clone OKT3
(50-112-2025)
– Lipopolysaccharide
(Fisher 50-112-2025)
– BioLegend CytoFix/CytoPerm
(BioLegend 426803)
– Brefeldin-A solution
(BioLegend 317325)
– Flow cytometry antibodies and
viability dye (vendor and catalog
number listed in Table 1)
– RPMI 1640 medium with GlutaMAX
(Gibco)
– LEGENDplex COVID-19 Cytokine
Storm Panel 1 (14-plex)
(Biolegend 741089)
– LEGENDplex COVID-19 Cytokine
Storm Panel 2 (13-plex)
(Biolegend 741112
PBMC isolation and
cell stimulation
PBMC were isolated according to
the manufacturer’s instructions and
resuspended in RPMI 1640 GlutaMAX,
supplemented with 10% FBS. Cells
were plated (1 million cells/mL) with
LPS (1 ng/mL) or added to αCD3 or IgG
antibodies coated on 96-well microplates
with and without the addition of
Brefeldin-A. Antibodies were coated at
1 µg/mL for 2 hours at 37 °C, the excess
antibody was removed by washing wells
with media before plating cells.
Flow cytometric analysis of
intracellular cytokine production
After 15 hours of incubation with
stimulation reagents and Brefeldin-A,
cells were collected for flow cytometry
staining. Cells were stained with
Zombie UV viability dye in PBS at a
dilution of 1:500 for 10 minutes at room
temperature and were protected from
light, followed by an antibody cocktail
of CD45 PE-Dazzle 595, CD3 BV510,
CD4 PercpCy5.5, CD8 BV785, CD19
FITC, CD14 BV711, CD56 BV605, and
CD16 BUV737 that were added for
20 minutes at room temperature, also protected from light. Next, cells were fixed using Cyto-Fast Fix/Perm kit for 20 minutes at room temperature and were protected from light. They then were washed with Cyto-Fast Perm wash solution and resuspended in IL-2 APC, TNFα BV421, IFN-γ PE antibodies, diluted in perm wash solution for 20 minutes at room temperature, and were protected from light. Cells were acquired on the NovoCyte Penteon flow cytometer and analyzed using the NovoExpress software.
Quantification of cytokine production using the LEGENDplex bead-based flow cytometry assay At 24 and 48 hours after stimulation, the supernatant was collected from wells to quantify the concentration of 27 cytokines using the LEGENDplex COVID-19 cytokine storm panel 1 and panel 2, following the manufacturer’s instructions. Samples were analyzed using the NovoCyte Penteon and data were analyzed using the LEGENDplex analysis software
Quantification of cytokine production
using the LEGENDplex bead-based
flow cytometry assay
At 24 and 48 hours after stimulation,
the supernatant was collected from
wells to quantify the concentration of
27 cytokines using the LEGENDplex
COVID-19 cytokine storm panel 1 and
panel 2, following the manufacturer’s
instructions. Samples were analyzed
using the NovoCyte Penteon and data
were analyzed using the LEGENDplex
analysis software
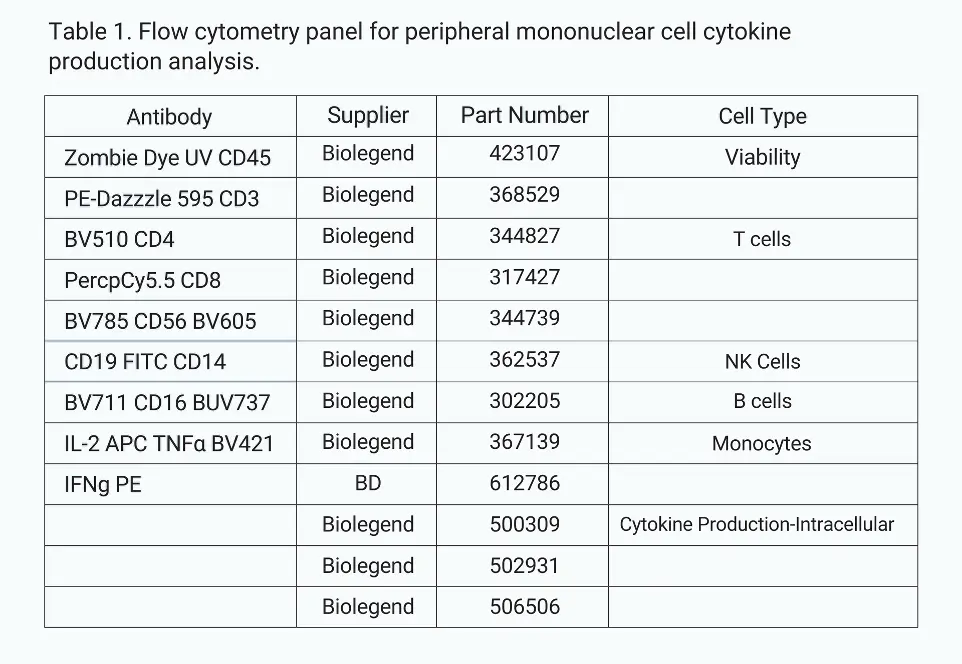
Results and discussion Examination of intracellular cytokines is one of the few assays that allow for the identification of cytokine-producing cells without requiring isolation of a pure cell population first. A flow cytometry panel was designed for the NovoCyte Penteon to determine the frequency of cells producing three major cytokines, IL-2, IFNγ, and TNFα, with surface markers to identify major cell populations in PBMC: Monocytes, T cells, NK cells, and B cells (Table 1). PBMC were stimulated either with plate-bound αCD3 antibody, LPS, IgG control, or PBS control for 15 hours. Brefeldin-A was added to cells to block the secretion of cytokines so cytokines can be detected within cells. After 15 hours of stimulation, cells were stained with a Zombie UV viability dye, CD45 PE-Dazzle 595, CD3 BV510,
CD4 PercpCy5.5, CD8 BV785, CD19 FITC, CD14 BV711, CD56 BV605, and CD16 BUV737 antibodies. Cells were then fixed and stained for intracellular cytokines using IL-2 APC, TNFα BV421, and IFN-γ PE antibodies. Cells were acquired on the NovoCyte Penteon and analyzed using NovoExpress software. After gating single cells using forward scatter (FSC) height and area, live cells were identified as Zombie UV negative cells (Figure 1). Next, lymphocyte and monocyte populations were gated based on side scatter (SSC) and expression of CD45 and lymphocyte populations were further distinguished by expression of CD19 and CD3, identifying B lymphocytes T lymphocytes, respectively. The CD19-CD3- population was then analyzed for the expression of CD56 to identify NK cells, while the CD3+ T cells were categorized into either CD4+ or CD8+ T cells. Monocyte populations were identified by the expression of CD14 or CD16; however, CD16 and CD14 expression on monocytes decrease rapidly in vitro. It has been reported that following even short in vitro incubation of monocytes, CD16 expression is lost, explaining the low frequency of CD16+ cells in these experiments.
Therefore,
monocyte populations were identified for
downstream analysis by SSC and CD45
expression alone, and monocytes, T cells,
B cells, and NK cells were each analyzed
for production of IL-2, TNFα, and IFN-γ.
αCD3 antibody activation specifically
targets the T cell receptor (TCR) pathway,
resulting in rapid T cell activation.
Generally, when T cell activation and
cytokine production are measured,
T cells are cultured for 3 to 5 days
and then restimulated with mitogens
PMA/Ionomycin to cause rapid cytokine
release. In this study, we aimed to
determine if early-stage T cell activation
was easily measured by intracellular
staining to enable a quick assay for
cytokine production and activation that
does not rely on proxy cellular activation markers.
For this, IL-2, IFN-γ, TNFα producing CD3+ T cells were quantified 15 hours after stimulation and compared to IgG-stimulated controls in PBMC from two donors (Figure 2). CD3+ T cells were approximately 3% IL-2+, 4% IFN-γ+, and 7.5% TNFα+, and a significant portion of these cells were positive for more than one marker. In control IgG stimulated samples, no significant cytokine production was seen. IFN-γ and TNFα cytokine production occurred in the NK and monocyte populations from indirect activation by activated T cells (Figure 1, see NK and monocyte population). Therefore, analyzing early production of cytokines in αCD3 antibody-activated PBMC is achievable for T cells, NK cells, and monocytes. LPS is a molecule naturally occurring in the cell wall of gram-negative bacteria that results in rapid immune activation and the release of inflammatory cytokines.
During a bacterial infection, if the cytokine response is not correctly regulated, inflammatory cytokines are overproduced, resulting in tissue damage. LPS has been shown to activate monocyte populations through the cell surface Toll-like receptor 4 (TLR4). Many studies look at short-term (less than 6 hours) LPS stimulation resulting in rapid monocyte activation and cytokine production. Here, the effect of low concentration LPS stimulation for a longer incubation time was investigated to determine if different stimulations agents (such as αCD3 and LPS) could be analyzed in one experiment and to determine if any unanticipated cytokines appear after a longer incubation. After 15 hours with LPS (about a tenth of the typical concentration used), PBMC were stained with the same flow cytometry panel, as described in Figure 3. There was a substantial number of TNFα-producing monocytes in both donor PBMCs at 22 and 23%. No significant amount of IL-2 or IFN-γ was observed from monocytes, which was expected, as T cells are the main drivers of IL-2 and IFN-γ production. Cytokine production from other cell populations was not observed after LPS stimulation. Together, this data verifies that PBMC is activated following αCD3 and LPS and that LPS is specifically activating the monocyte population. While αCD3 antibody targets T cells, it also results in indirect cytokine production from NK and monocyte populations.
To further investigate the cytokines produced from activated PBMC, the Biolegend LEGENDplex COVID-19 cytokine storm panel was used to measure the secretion of 27 cytokines. PBMC were stimulated as described, either with LPS or αCD3 antibody or controls. After 24- and 48-hour stimulation, cell culture supernatant was collected and used for cytokine analysis.
The LEGENDplex COVID-19
Cytokine Storm Panel 1 quantifies the
expression of IL-6, CCL2 (MCP-1), G-CSF,
IFN-α2, CCL5 (RANTES), IL-2, IFN-y, IL-7,
IL-1RA, CXCL8 (IL-8), TNFα, CXCL10
(IP-10), CCL3 (MIP-1a), and IL-10. The
LEGENDplex COVID-19 Cytokine Storm
Panel Panel 2 quantifies the expression
of IL-13, GM-CSF, IL-1β, IL-5, sCD25
(IL-2Ra), IL-4, VEGF, IL-17A, IL-18, APRIL,
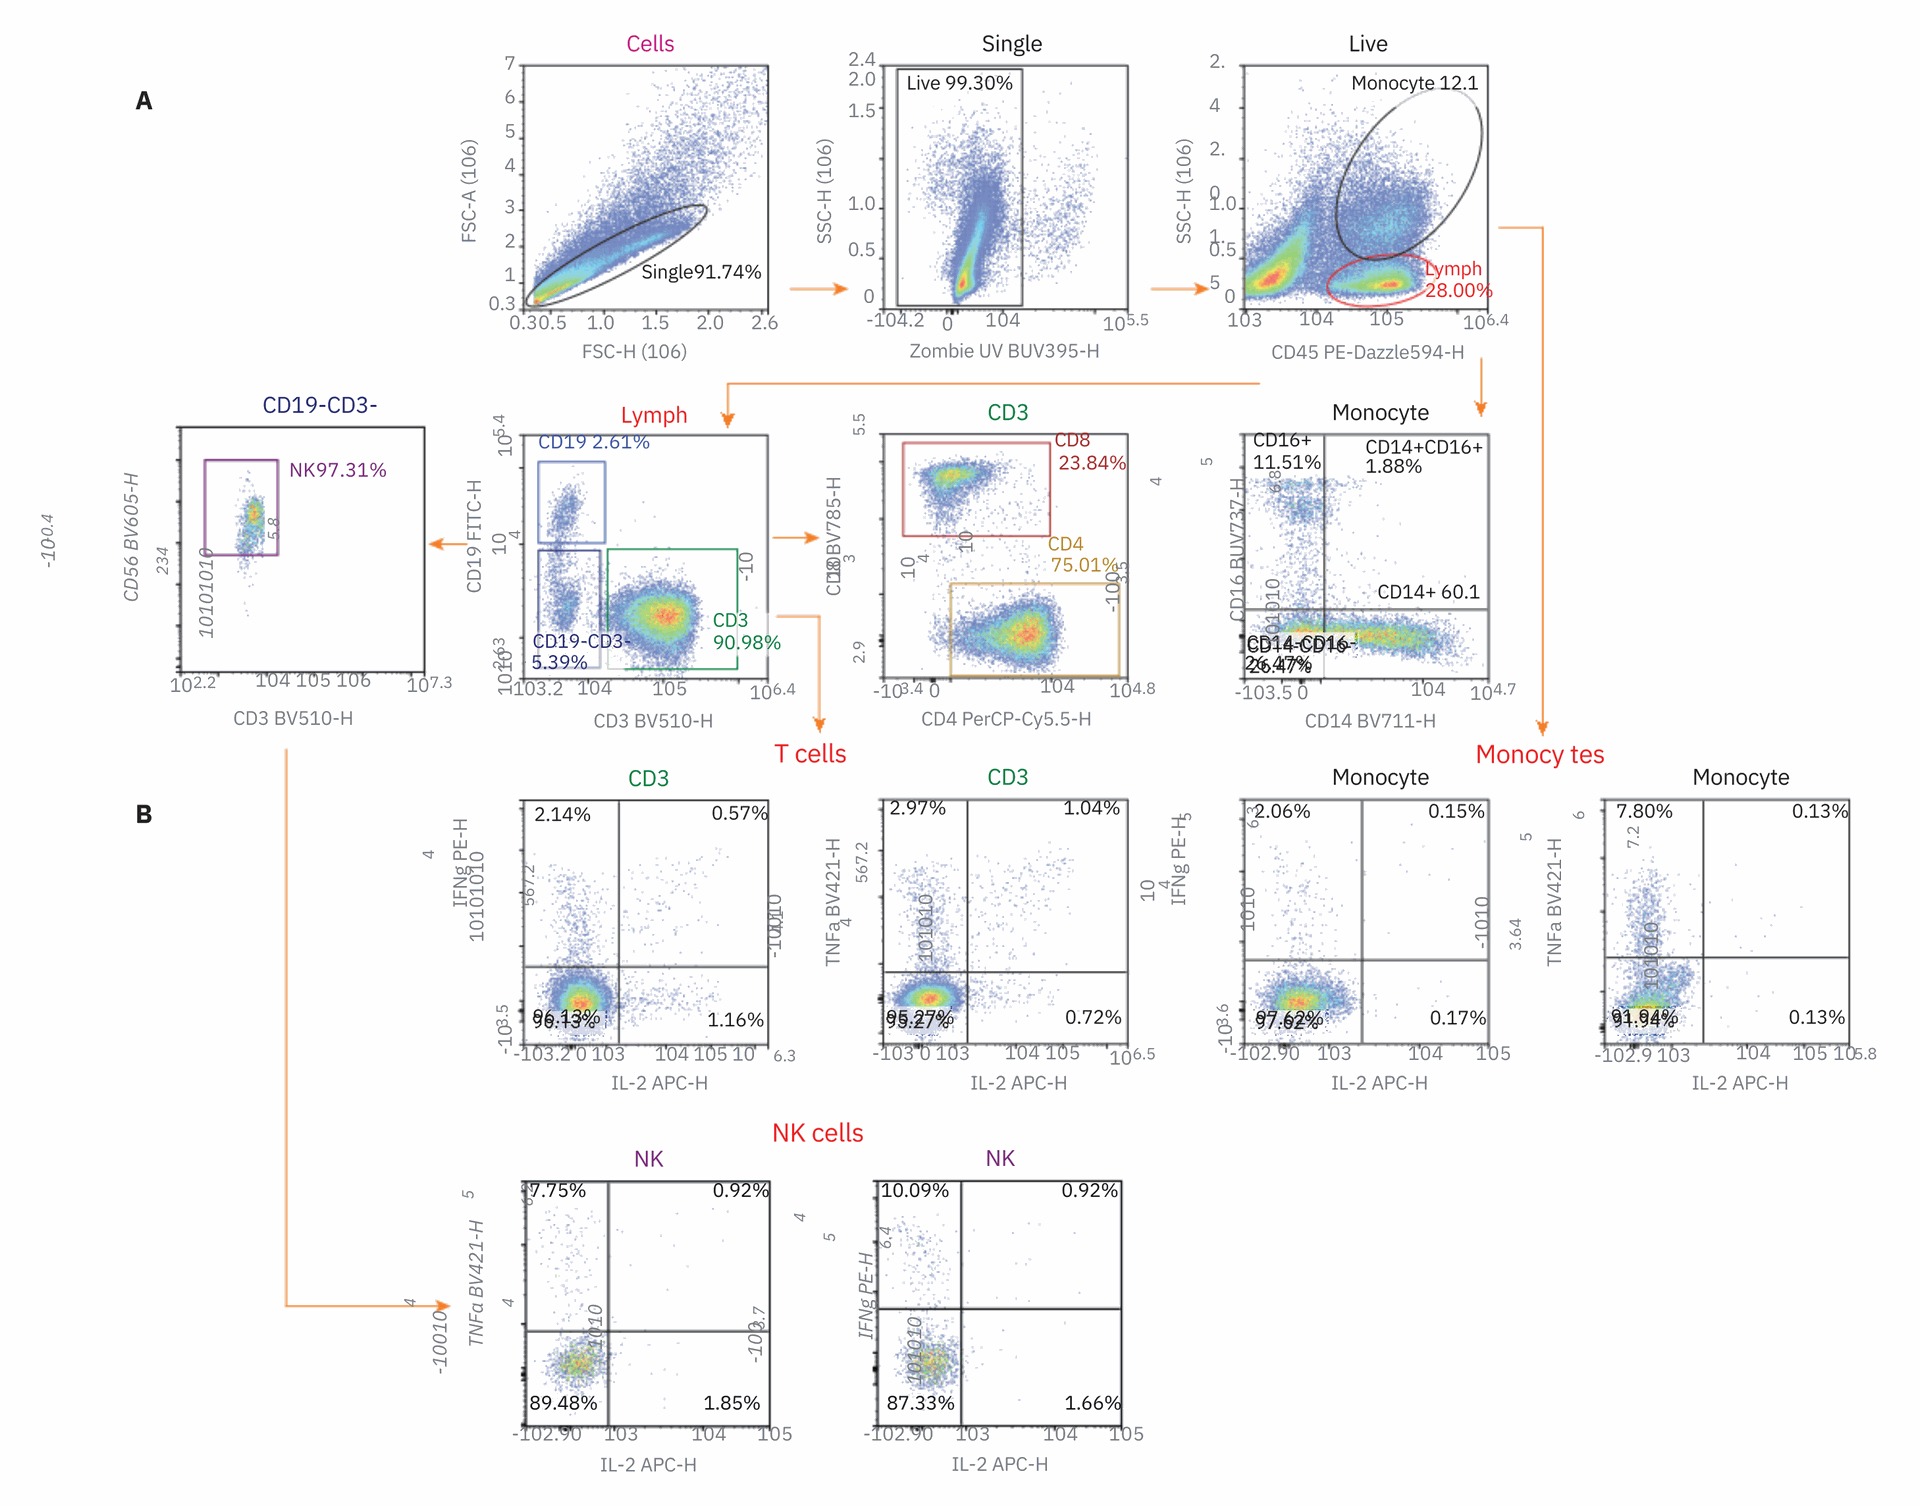
Figure 1. Gating strategy for cell specific cytokine production. Gating hierarchy used for the flow cytometry panel described in Table 1. Isolated peripheral blood
mononuclear cells (PBMCs) were stimulated with LPS or added to an anti-CD3 antibody coated plate and cultured from 15 hours with the addition of Brefeldin A.
The example shown in this figure was stimulated with CD3 antibody. Cells were then stained with antibody panel and analyzed on the NovoCyte Penteon.
.
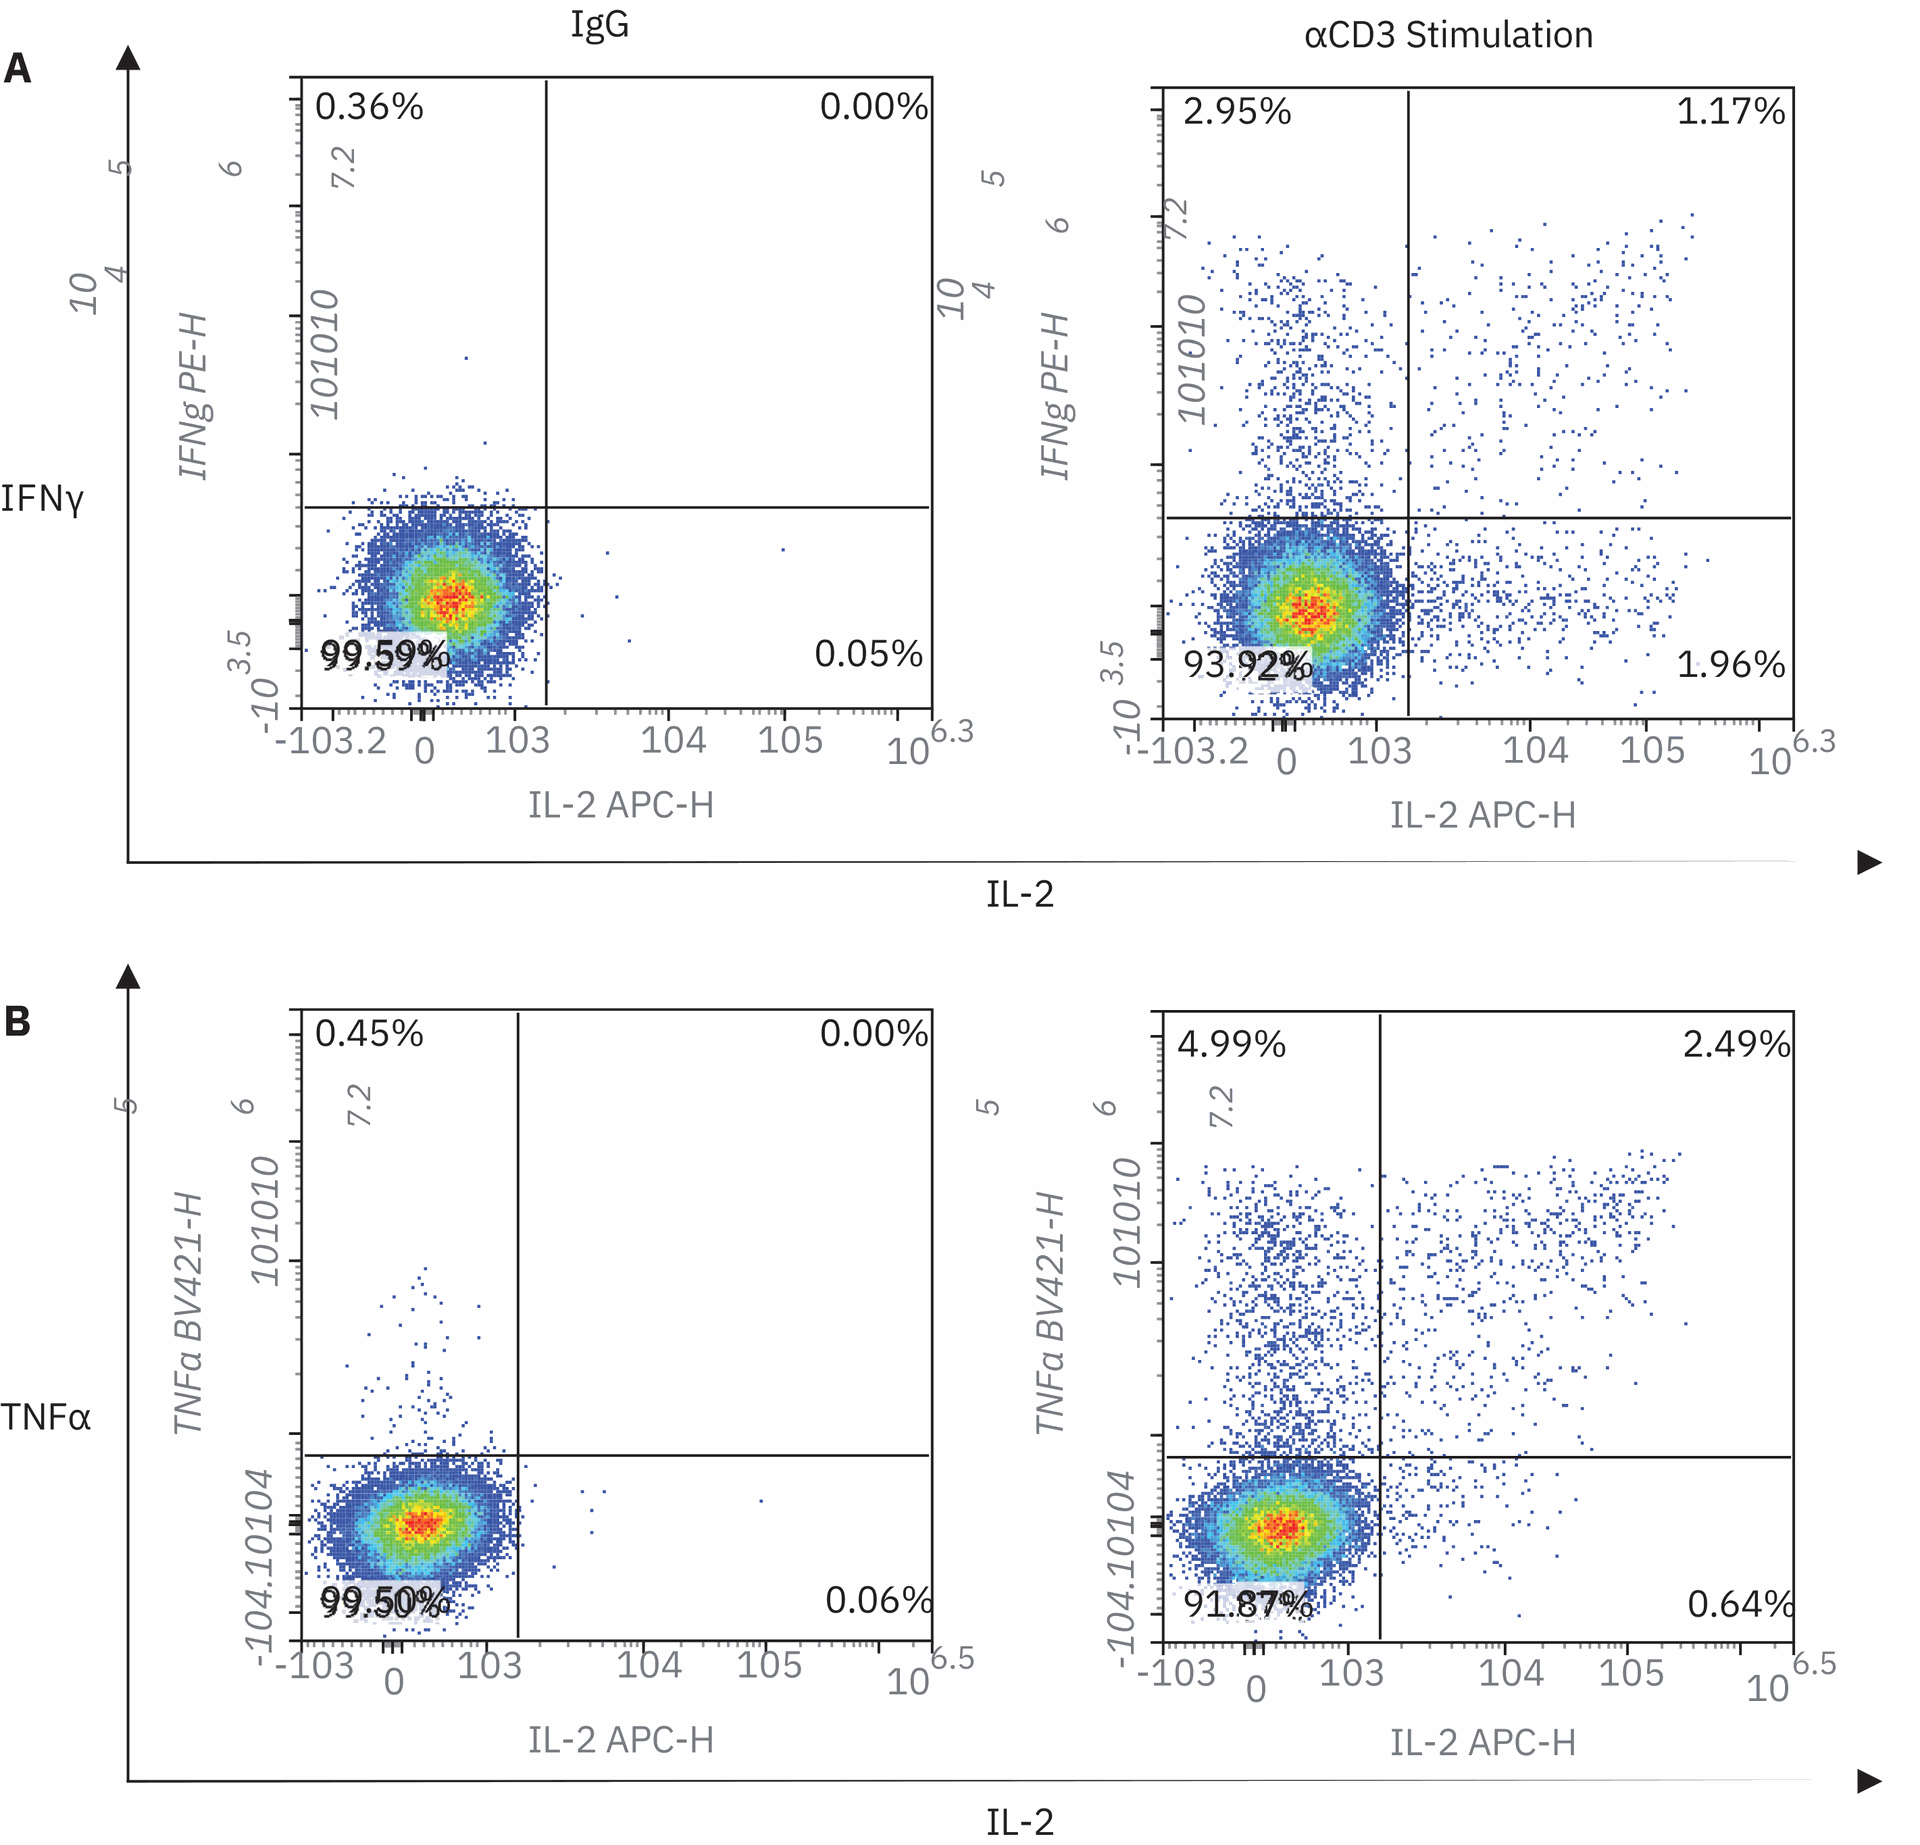
Figure 2. T Cytokine production after αCD3 antibody activation. PBMCs were activated 15 hours on αCD3
(right) or IgG (left) control coated microtiter plates (1 µg/mL) followed by antibody staining. CD3+ T cells
were gated according to the gating hierarchy shown in Figure 1 and then assessed for production of
IFN-y (A), TNFα (B), and IL-2 (A,B).
Figure 3. Monocyte Cytokine production after αCD3 antibody activation. PBMCs were activated 15 hours with PBS control (A, left) or LPS 1 mg/mL (A, right) followed by antibody staining. Monocytes were gated according to the gating hierarchy shown in Figure 1, then assessed for production of TNFα , IL-2, and IFN-γ (IFN-γ not shown) (A). TNFα positive cells were then assessed for expression of monocyte markers CD14 and CD16 (B).
CCL4 (MIP-1b), IL-15, and IL-12p70. This covers many inflammatory and anti-inflammatory cytokines that are produced by several cell populations including T cells and monocytes. Cytokine production after αCD3 stimulation was compared to controls by the fold change, relative to IgG, and
cytokine production after LPS stimulation was compared using fold change relative to PBS (Figure 4). In Figure 4, the results from one donor at 48 hours were plotted for all 27 cytokines. Most cytokines increased (aside from APRIL and IL-15) under both stimulation conditions. Only small increases, less than a 10-fold
change, were seen in the secretion of IFN-α2, IL-7, and VEGF. Notably, small differences were seen between the two donors in the quantity of cytokines produced; however, both displayed the same trend in the production of cytokines at 24 and 48 hours (data not shown).
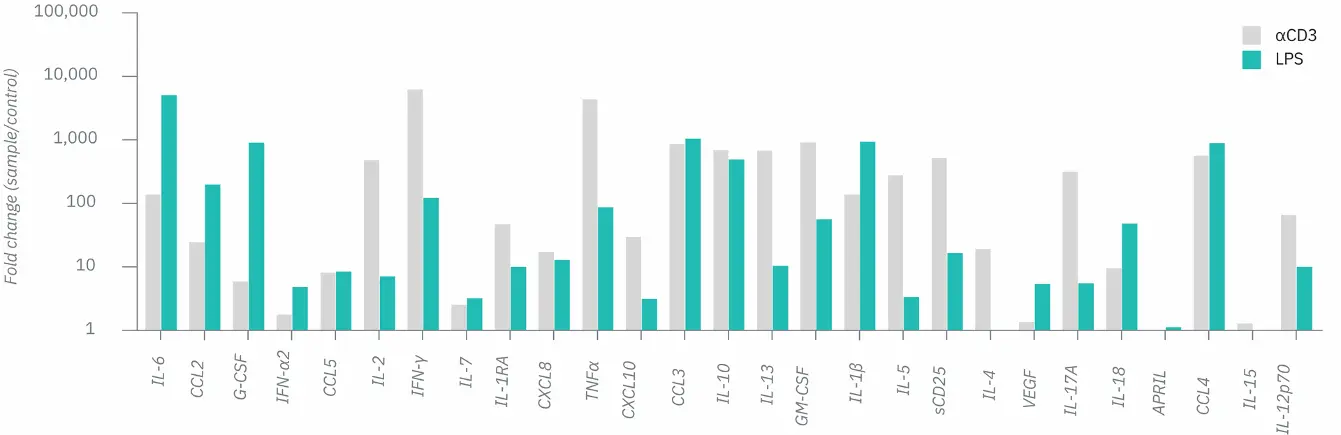
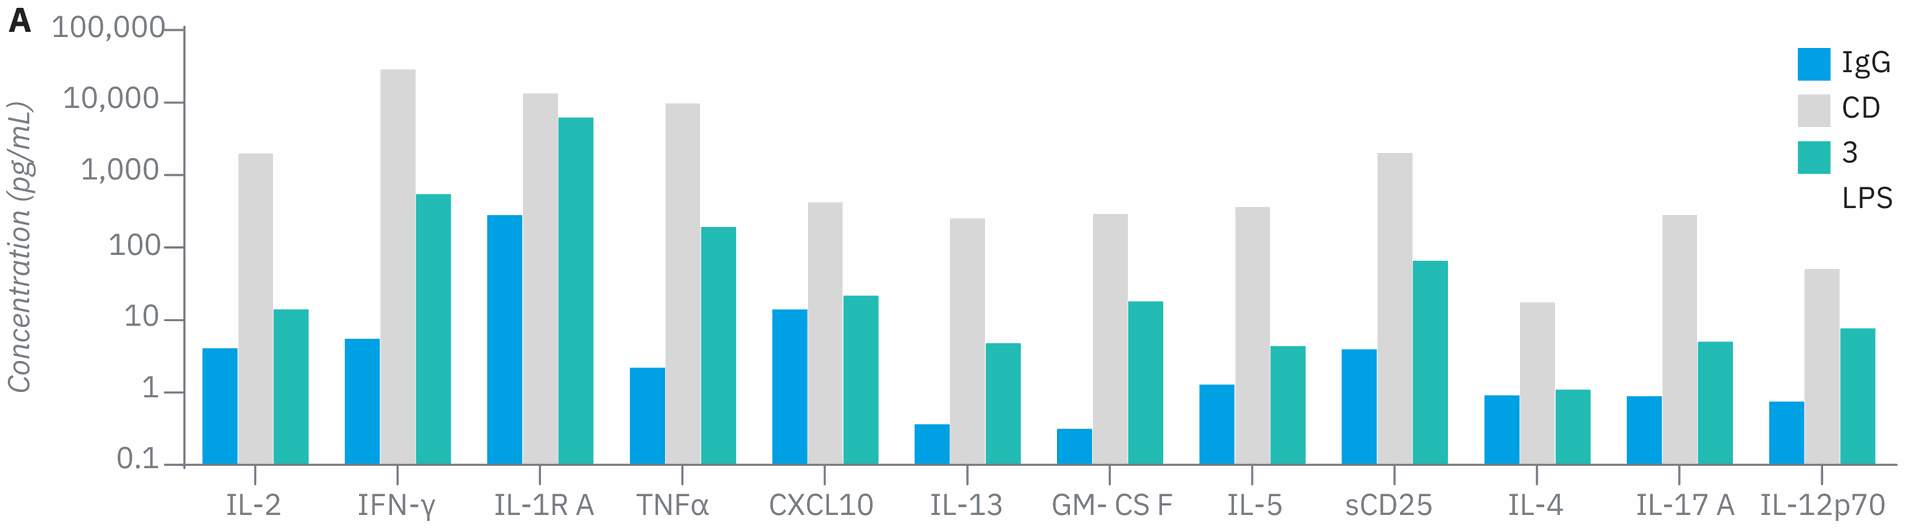
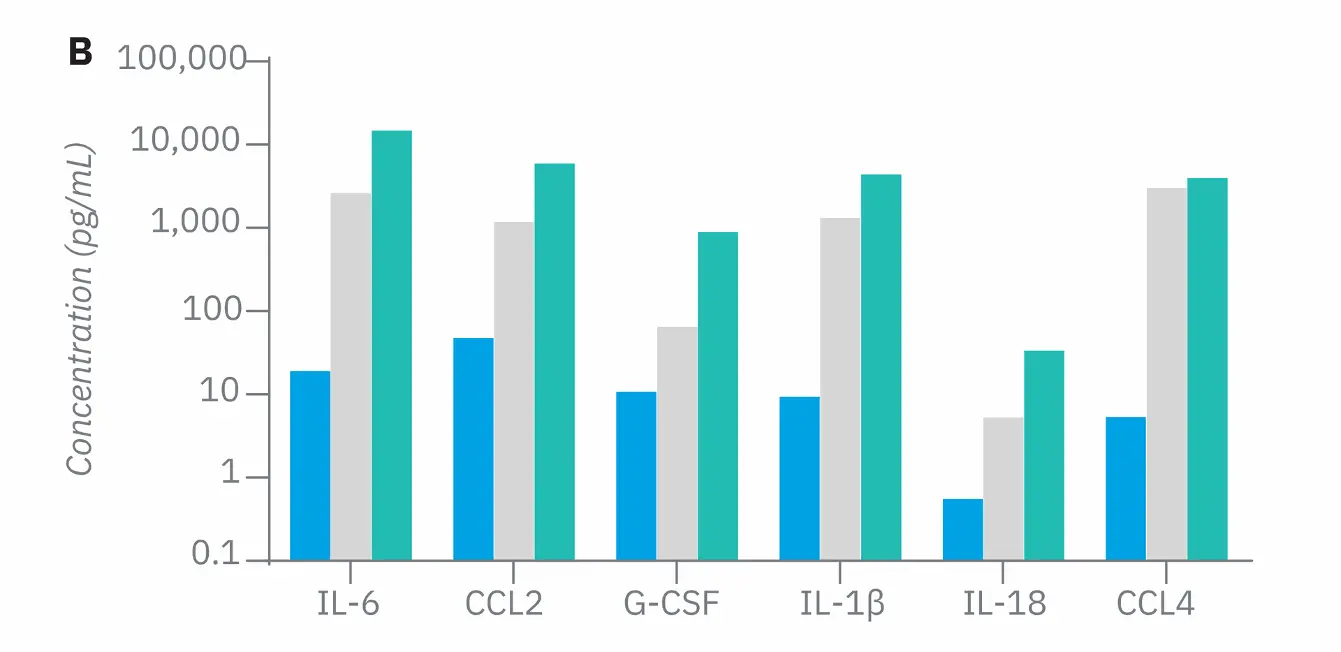
Figure 4. Assessment of the secretion of 27 cytokines with the LEGENDplex COVID-19 Cytokine Storm Panels 1 and 2. Isolated PBMCs were stimulated with
LPS (1 ng/mL) PBS control or αCD3/IgG control coated microtiter plates (1 µg/mL). Supernatant was collected at 24- and 48-hour post stimulation. Cytokine
production was quantified used the LEGENDplex COVID-19 Cytokine Storm Panels 1 and 2. Here, the fold change in secreted concentration was compared from aCD3 stimulation to IgG control (grey) and LPS to PBS control (green). Any samples that was over the limit of detection was set as the highest value on the
standard curve so that fold change could still be calculated.
Next, the concentration of cytokines that increased more with either αCD3 or LPS stimulation were plotted to further investigate the results (Figure 5). αCD3 antibody stimulation of PBMCs increased IL-2, IFN-γ, IL-1RA, TNFα, CXCL10, IL-13, GM-CSF, IL-5, sCD25, IL-4, and IL-12p70 at least 10 times more than
LPS stimulation. Almost all the cytokines upregulated with αCD3 stimulation are produced by T cells, excluding CXCL10 and IL-12p70, which are primarily produced by monocytes and are induced by IFNγ (highly produced after CD3 stimulation). This demonstrates that the in vitro PBMC response to CD3 is driven by T cells, but also can be influenced by other cells present. Cytokines that highly increased in the LPS sample include IL-6, CC2, G-CSF, IL-1b, IL-18, and CCL4, which are all primarily produced by monocytes and macrophages. This confirms that the in vitro PBMC response to LPS is primarily driven by monocyte and macrophage activation.
Conclusion
The flow cytometry-based LEGENDplex assays can be used to assess cytokine production and immune activation due to a novel biologic, therapeutic, or pathogen both for in vitro and biological samples. These cytokine panels that detect cytokines derived from monocytes, T cells, and NK cell activation provide an in-depth analysis of the immune cell response following stimulation. Using the LEGENDplex bead-based cytokine detection assay permits an unbiased assessment of cytokine production, which can elucidate unknown immune cell responses. Cytokine response assays used to assess cytokine responses to novel therapeutics primarily measure cytokines produced by T cells, which may result in an undetected cytokine response before further in vivo testing. When coupling cytokine measurements with intracellular cytokine staining, the cellular origin of the cytokine produced can also be used to provide more insight on cell types influenced by the stimulation. Using these two assays together allows for a detailed assessment of immune cell activation.
For Research Use Only. Not for use in diagnostic procedures.
RA44420.382037037
This information is subject to change without notice.
© Agilent Technologies, Inc. 2021 Printed in the USA, October 11, 2021 5994-4033EN
References
Fajgenbaum, D. C. et al. Cytokine Storm. N. Engl. J. Med. 2020, 383, 2255–2273 DOI: 10.1056/ NEJMra2026131
Finco, D. et al. Cytokine Release
Assays: Current Practices and Future
Directions. Cytokine 2014, 66(2),
143–155
Zirui, M. et al. The Trinity of
COVID-19: Immunity, Inflammation
and Intervention. Nature Reviews
Immunology 2020, 20(6), 363–374.
doi:10.1038/s41577-020-0311-8
de la Rica, R.; Borges, M.; Gonzalez-Freire, M. COVID-19: In the Eye of the Cytokine Storm. Front. Immunol. 2020 Sep 24, 11, 558898. doi: 10.3389/fimmu.2020.558898. PMID: 33072097; PMCID: PMC7541915.
Huang, C. et al. Clinical Features of
Patients Infected with 2019 Novel
Coronavirus in Wuhan, China. Lancet
2020, 395, 497–506. doi: 10.1016/
S0140-6736(20)30183-5
Lucas, C. et al. Longitudinal Analyses Reveal Immunological Misfiring in Severe COVID-19. Nature 2020, 584, 463–469. https://doi.org/10.1038/ s41586-020-2588-y
Lawlor, N. et al. Single Cell Analysis
of Blood Mononuclear Cells
Stimulated Through CD3 and CD28
Shows Collateral Activation of B and
NK Cells and Demise of Monocytes.
bioRxiv 2020,12.23.424147. https://
doi.org/10.1101/2020.12.23.424147