Cell Death Monitoring: Imaging & Impedance
Learn more about Combining Live Cell Imagin with Cellular Impedance to Monitor Apoptotic Cell Death
Abstract
T cells are an essential part of the immune response, capable of recognizing and eliminating foreign pathogens and tumor cells. However, tight control of the T cell response is necessary to prevent autoimmunity and immunopathology. A 16-color T cell immunophenotyping panel was developed for the Agilent NovoCyte Advanteon to simultaneously analyze T cell differentiation, activation, exhaustion, and functional output through degranulation and cytokine expression. This flow cytometry panel provides comprehensive analysis of T cell function in an immune response.
Authors
Lauren Jachimowicz, Ming Lei, Peifang Ye, Yan Lu, and Garret Guenther Agilent Technologies, Inc.
Introduction
The role of the immune system is to fight off pathogens while limiting autoimmunity. T cells are an important part of the adaptive immune response, capable of recognizing specific antigens and resolving infections. In a normal immune response, T cells are activated to rapidly divide and destroy all infected or cancerous cells. Activation through the T cell receptor (TCR) and costimulatory receptors must be balanced with inhibitory receptors such as programmed cell death protein 1 (PD-1), lymphocyte-activation gene 3 (LAG-3), and T cell immunoglobulin and mucin-domain containing-3 (TIM-3).This is needed to prevent the development of autoimmunity and immunopathology.
When stimulation of T cells is sustained, there is a progressive increase in the expression of inhibitory receptors and a decrease in T cell effector function and proliferative capacity (T cell
exhaustion). This can be seen during a chronic infection or cancer. Inhibitory receptors have become a focus of cancer immunotherapy research because reversing inhibitory receptor
expression through checkpoint inhibitor blockade has restored T cell function and improved tumor immunity in the clinic. The severity of T cell exhaustion correlates heavily with the co-expression of multiple inhibitory receptors, making combination therapy promising because
multiple inhibitory receptors are targeted, demonstrating an increase in tumor
immunity. Analysis of T cell inhibitory receptor expression alone does not provide a comprehensive view of T cell state. Measuring additional markers for T cell differentiation, activation, previous antigen exposure, degranulation, and cytokine production provides a more comprehensive understanding.
Studies have identified inherent differences in inhibitory receptor expression among naive, effector, and memory T cell subsets. A 16-color immunophenotyping panel was designed to run on the NovoCyte Advanteon (Table 1) to examine CD4 and CD8 T cell differentiation and activation state, and measure functional T cell responses. Using the NovoCyte Advanteon’s high capacity for multiparameter analysis, these data demonstrate a comprehensive look at the kinetic changes that occur in T cell subsets and function after stimulation.
In depth analysis of T cell state after TCR stimulation to fully examine the T cell response to TCR activation, we looked at differentiation, activation, and inhibitor markers as well as degranulation and cytokine production in CD4 and CD8 T cells (Table 1). Isolated peripheral blood mononuclear cells (PBMCs) were stimulated with anti-CD3, anti-CD28 antibodies, and interleukin-2 (IL-2) to induce T cell activation. Six hours before flow cytometric analysis, cytokine secretion was blocked with a protein transport inhibitor. Samples were measured initially after two and four days in culture, and again on day 5 after being restimulated. Figure 1 demonstrates a representative gating strategy for the day 4 sample. First, dead cells were excluded using viability dye followed by examining the frequency of CD4 and CD8 T cells within the total CD3 T cell population. Next, T cell differentiation was assessed by determining the relative frequency of T cell subsets based on surface expression of CD45RA and CCR7. T cells are separated into Naive‑like T
naive-like (CD45RA+/CCR7+), central memory T (CD45RA-/CCR7+), effector memory CM
TEM (CD45RA-/CCR7-), and CD45RA+effector memory T
EMRA (CD45RA+/CCR7–). Furthermore, T naive-like are separated into true (T memory T cells (T
naive) and T stem‑cell SCM) by the expression of CD95 on T SCM.

Next, the expression of inhibitory receptors PD-1, TIM-3, and LAG-3 was examined as well as activation markers CD25 and CD127. These markers provide additional information on the activation state of the T cells. Finally, production of cytokines IL-2, tumor necrosis factor alpha (TNFα), and interferon gamma (IFNγ) were measured as well as degranulation by expression of CD107α, which demarcates cytolytic T cells. All gates were determined with the use of fluorescence minus one (FMO) controls (Figure 1D). Four days after stimulation, most cells had undergone T cell activation, and there were no longer any naive cells in both the CD4 and CD8 T cell T populations. A large upregulation in CD25 expression and downregulation of CD127 was seen in T cells, also consistent with highly activated T cells. Both CD4 and CD8 T cells had upregulated inhibitory receptor expression, although not all cells had positive expression.
Cytokine production of TNFα and IFNγ was also present while only minimal IL-2 production was observed. Most T cells were also CD107α positive, showing that they had cytolytic potential. This high-parameter staining panel with the NovoCyte Advanteon allows extensive analysis of T cells after stimulation. Next, kinetic changes in the parameters measured were examined in T cells after TCR activation.
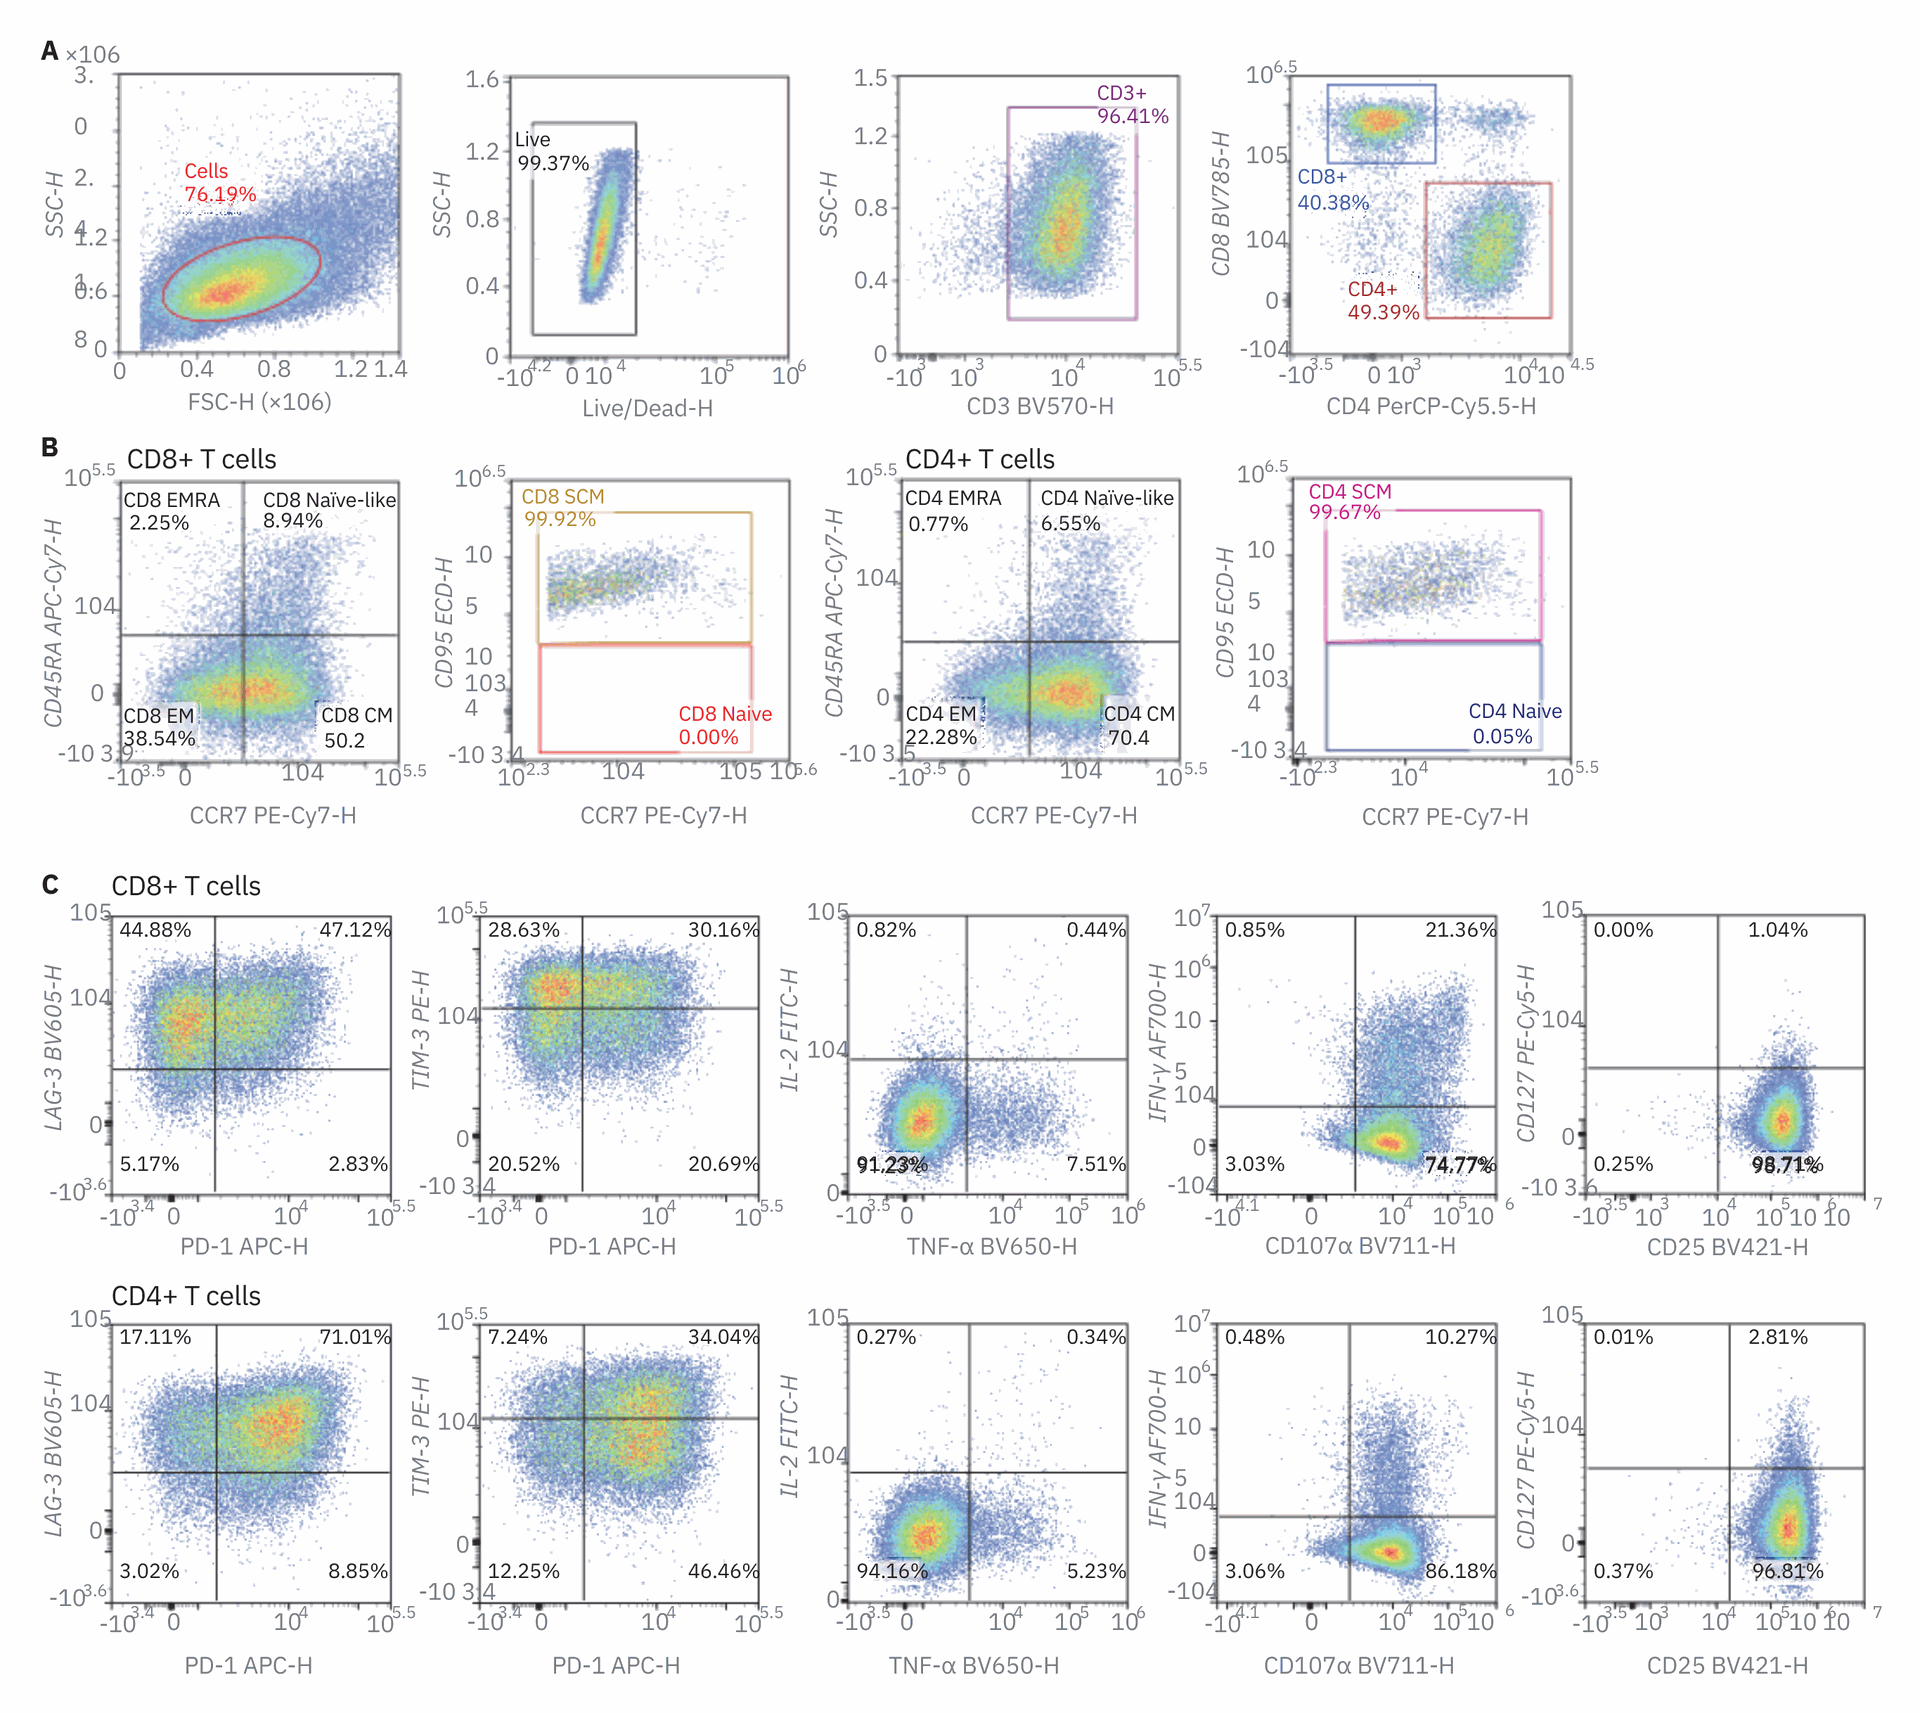
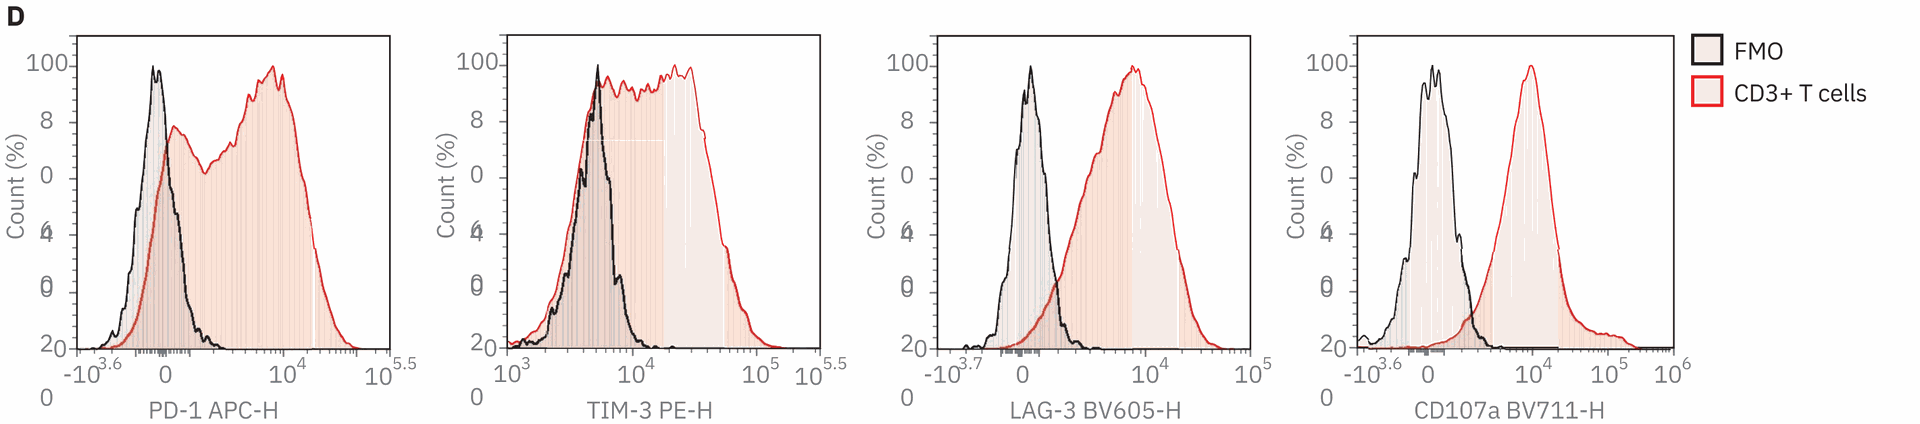
Figure 1. Immunophenotyping of stimulated PBMCs by a 16-color flow cytometry panel. PBMCs isolated from donor blood were stimulated with 5 µg/mL anti-CD3 antibody, 2 µg/mL anti-CD28 antibody, and 100 ng/mL IL-2. Stimulated PBMCs were stained with the 16-color immunophenotyping panel (Table 1) on day 4. Protein transport inhibitor cocktail (2 µL/well) and anti‑CD107α BV711 antibody (5 µL/mL) were added directly to the wells for six hours before analysis. (A) Gate strategy. FSC-H and SSC-H were used to identify target cells from debris; dead cells were excluded by Live/Dead dye. CD3 was used to identify T cells. Subsequent gating of CD3+ cells identified CD4+ and CD8+ T cells. Upon gating on CD4+ or CD8+ cells, T CM, TEM, and TEMRA cells were identified based on the differential expression of CD45RA and CCR7. From the CD45RA+CCR7+ population, CD95+ TSCM and CD95- naïve T cells were further detected (B). The expression level of CD25 and CD127, exhaustion level of PD‑1, LAG‑3, and TIM‑3, cytokine secretion level of IL‑2, TNF‑α, and IFN‑γ and degranulation level of CD107α were also examined within CD4+and CD8+ T cell subsets. The data shown here were from the sample harvested on day 4. (D) FMO controls. The gates were defined using FMO controls. FMO controls of PD‑1, TIM‑3, LAG‑3, and CD107α shown above. Samples were acquired on the Agilent NovoCyte Advanteon, and analyzed using NovoExpress software.
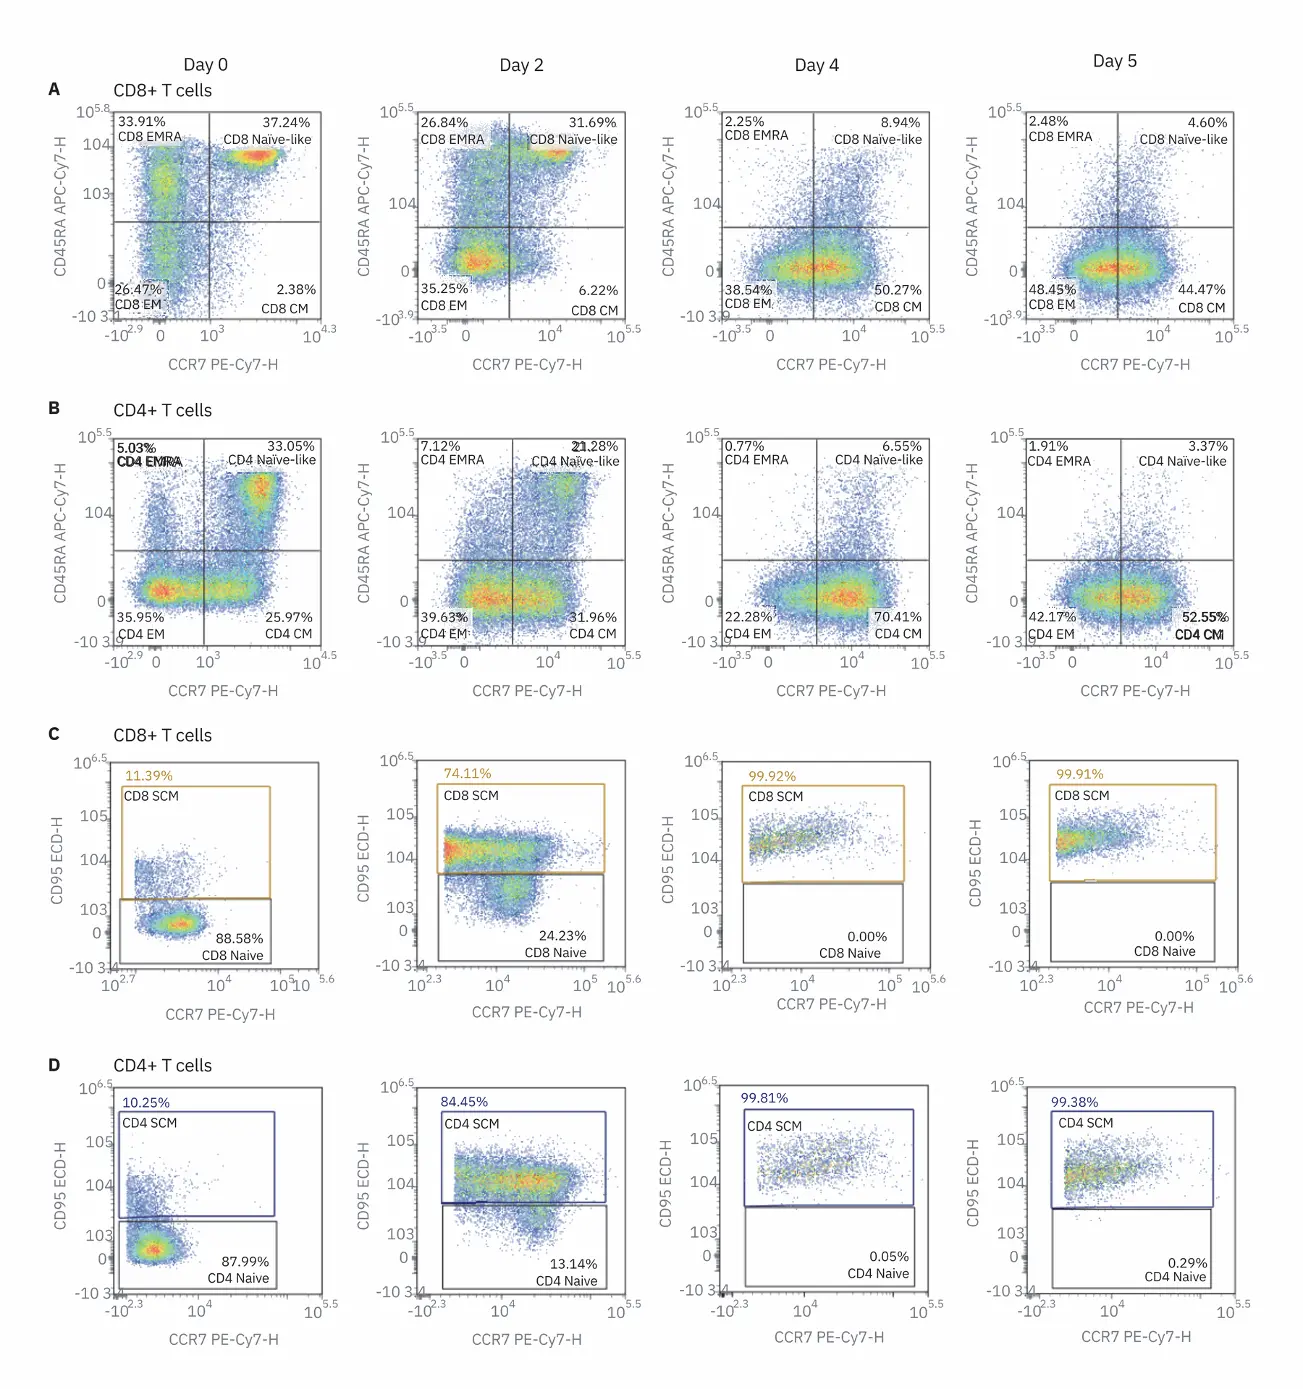
Continuous changes present in T cell differentiation state after stimulation TCR activation induces rapid changes in T cell differentiation. Differentiation status was examined by identifying
each subset: T
naive, TSCM, TCM, TEM, and
T section. Previous studies have identified functional differences between T cell
EMRA, as described in the previous
subsets; T
naive and TCM have high
proliferative capacity but lack rapid
effector function while T have less proliferative capacity but more extensive effector capabilities.
EM and TEMRA
SCM have experienced antigen stimulation but maintain the same stem-like properties of self-renewal as naive cells. To understand the changes T in T cell differentiation after stimulation, the relative frequencies of all T cell subsets were examined in unstimulated PBMCs and stimulated PBMCs after two and four days, and restimulated PBMCs at day 5 (Figure 2). As expected, the frequency of T naive cells decreases dramatically after two days of TCR stimulation; most CD45RA+ CCR7+ cells are TSCM, as they express CD95 as well
(Figure 2B). This is typical with ex vivo activation with anti-CD3/anti-CD28 antibody since it should activate all T cells present. The proportion of Tincreases steadily over time following stimulation, however, the proportion CM decreases after restimulation of T (day 5 sample). This indicates that restimulation induces a shift in T cells to an effector phenotype. Overall, ex vivo stimulation of PBMCs induces rapid T cell differentiation into multiple effector and memory cell subsets.
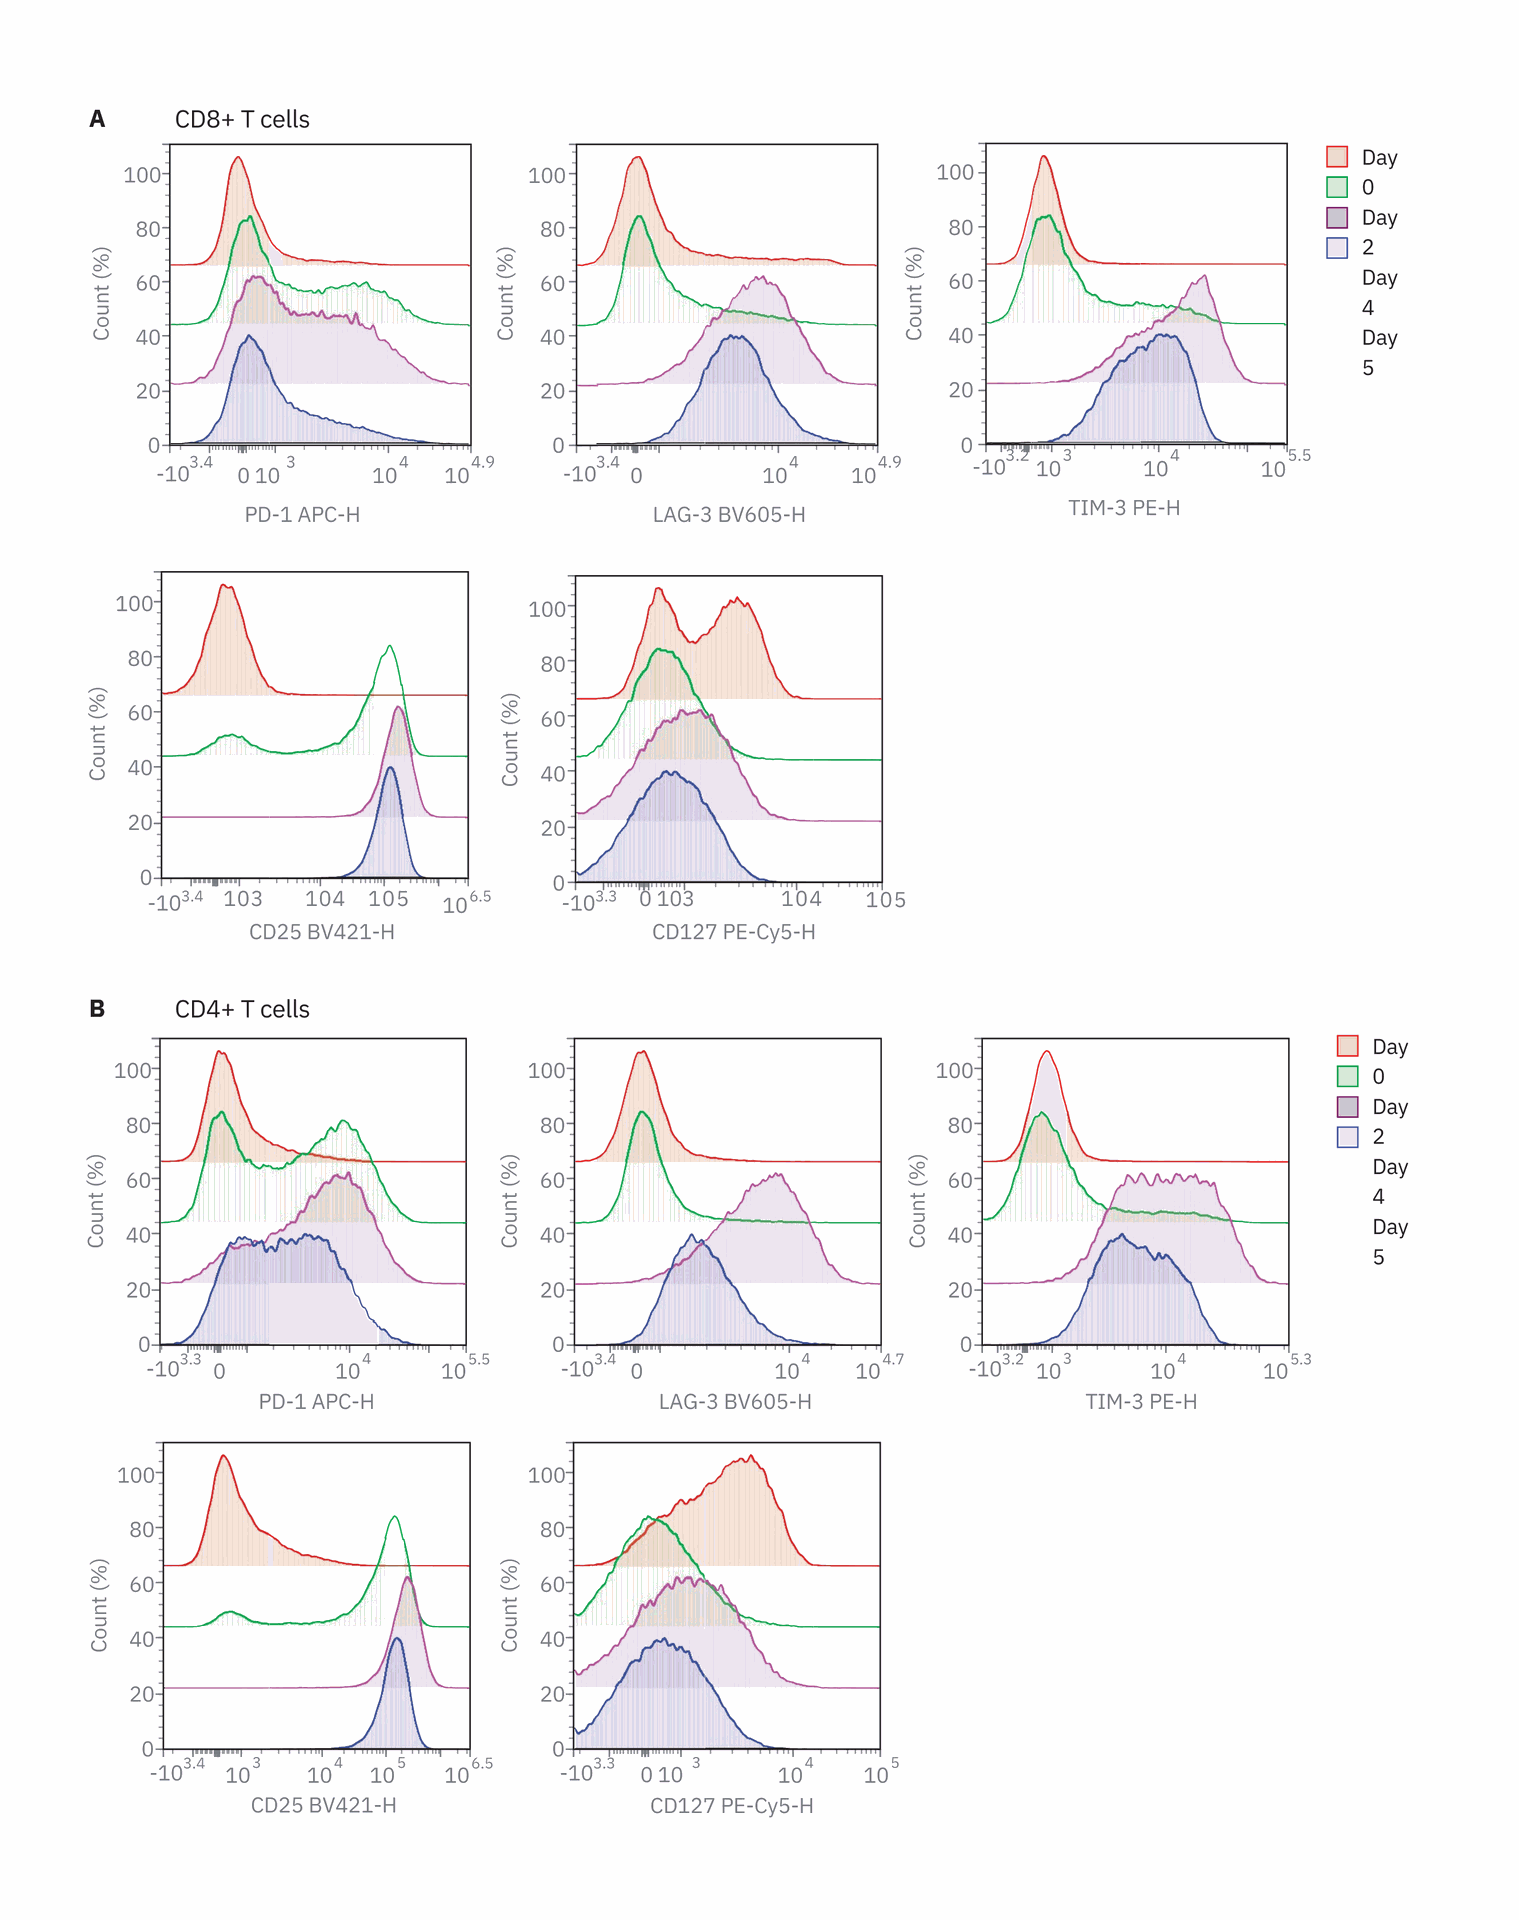
Progressive upregulation of inhibitor receptor upon TCR stimulation
With persistent stimulation, inhibitory receptor expression increases, and is a key indicator of T cell exhaustion. Efficient negative regulation by inhibitory receptors helps to restrain overexuberant immune responses. However, inhibitory receptors can also hinder effective immune responses to clear pathogens and tumors. Defining how inhibitory receptors are upregulated during acute and persistent T cell stimulation is essential for the development of safer and more effective therapeutic manipulations of these pathways.
Activation markers (CD25 and CD127) and inhibitory receptors (PD-1, LAG- 3, and TIM-3) were examined on days zero, two, and four and after restimulation on day five (Figure 3). CD25 was rapidly upregulated while CD127 was downregulated in both CD8 and CD4 T cells, demonstrating rapid activation of T cells. No immediate change was observed in the expression of the inhibitory receptors after two days of stimulation. However, after four days of stimulation, PD‑1, LAG-3, and TIM-3 were upregulated in both CD4 and CD8 T cell populations. After restimulation on day 5 with anti-CD3/CD28, all inhibitory receptors were downregulated. This coincided with a decrease in CCR7 expression and decrease in the percentage of T cells after restimulation. As T cells transition toward an effector phenotype, it is beneficial to decrease inhibitory receptor expression. This correlates with previous studies that suggest that T cell exhaustion occurs as cells move to a memory phenotype, despite the persistence of antigen. Examining inhibitory receptor expression in the context of various T cell phenotypes and functions provides an understanding of the how T cells are altered in the context of an immune response.
Conclusion
Thorough analysis of T cells allows a closer look into the T cell response by examining differentiation, activation, cytokine production, and degranulation simultaneously so that a more comprehensive understanding of T cells can be achieved. Using the NovoCyte Advanteon to perform this 16-color immunophenotyping panel can help further elucidate the T cell response in the context of persistent infection and tumor immunity.
References
1. https://www.ncbi.nlm.nih.gov/pmc/ ar ticles/PMC4889009/
2. https://journals.plos.org/plosone/ article?id=10.1371/journal. pone.0177405
3. https://onlinelibrary.wiley.com/doi/ full/10.1002/eji.201343751
4. https://www.jimmunol.org/ content/188/7/2957
5. https://www.ncbi.nlm.nih.gov/pmc/ ar ticles/PMC4481276/ https://www.frontiersin. org/ar ticles/10.3389/ fimmu.2017.01215/full https://onlinelibrary.wiley.com/doi/ epdf/10.1002/cyto.a.22938
For Research Use Only. Not for use in diagnostic procedures. DE.5361689815 This information is subject to change without notice. © Agilent Technologies, Inc. 2019, 2020
Printed in the USA, October 5, 2020
5994-1455EN