Application Note Cell Analysis
Comprehensive 18-Color Pan-Leukocyte Flow Cytometry Analysis for Immune Surveillance
Abstract
This application note describes the use of an 18-color immunophenotyping stain to examine leukocyte subsets in human peripheral blood mononuclear cells (PBMCs), using the Agilent NovoCyte Quanteon flow cytometer. This method simultaneously identifies and quantifies monocytes, B cells, plasmablasts, CD4+ and CD8+ T cells, regulatory T cells, γδ T cells, NK T cells, NK cells, and dendritic cells. NK and T cell status are indicators of a proper immune response to a vaccine, therefore NK and T cell activation and differentiation statuses were evaluated to obtain a deeper understanding of immune status.
Authors
Lauren Jachimowicz, PhD; Peifang Ye; Ming Lei; Kenneth Chan, PhD; Jeff Shurong Xue, PhD; and Garret Guenther, PhD
Agilent Technologies, Inc.
San Diego, CA, USA
Introduction
The human immune system is highly complex and research has shown that immune status is a critical component of the immune response to various stimuli. Simultaneous quantification of multiple leukocyte subsets allows for better surveillance of the immune response to infectious diseases and the immune status of subjects.
This multicolor flow cytometry staining panel is based on OMIP-024,
which was originally designed to measure leukocyte subsets in the PBMCs of children to evaluate vaccine efficacy. It was, therefore, important to obtain the maximum information concerning the status of the immune system with a small amount of blood.
Monitoring the frequency of numerous immune cell populations, as well as the differentiation/activation status of specific cell subsets, such as monocytes, NK cells, T cells, and B cells, is essential as they may influence the immunogenicity of a vaccine and its efficiency.
With the increasing capabilities of flow cytometers to perform complex multicolor analysis, the opportunity to evaluate more immune subsets is made possible. By analyzing the expression of each marker, fluorescence intensity, spectral overlap, and Agilent NovoCyte Quanteon configuration, an 18-color immunophenotyping panel was designed for studying human PBMCs using the NovoCyte Quanteon (Table 1).
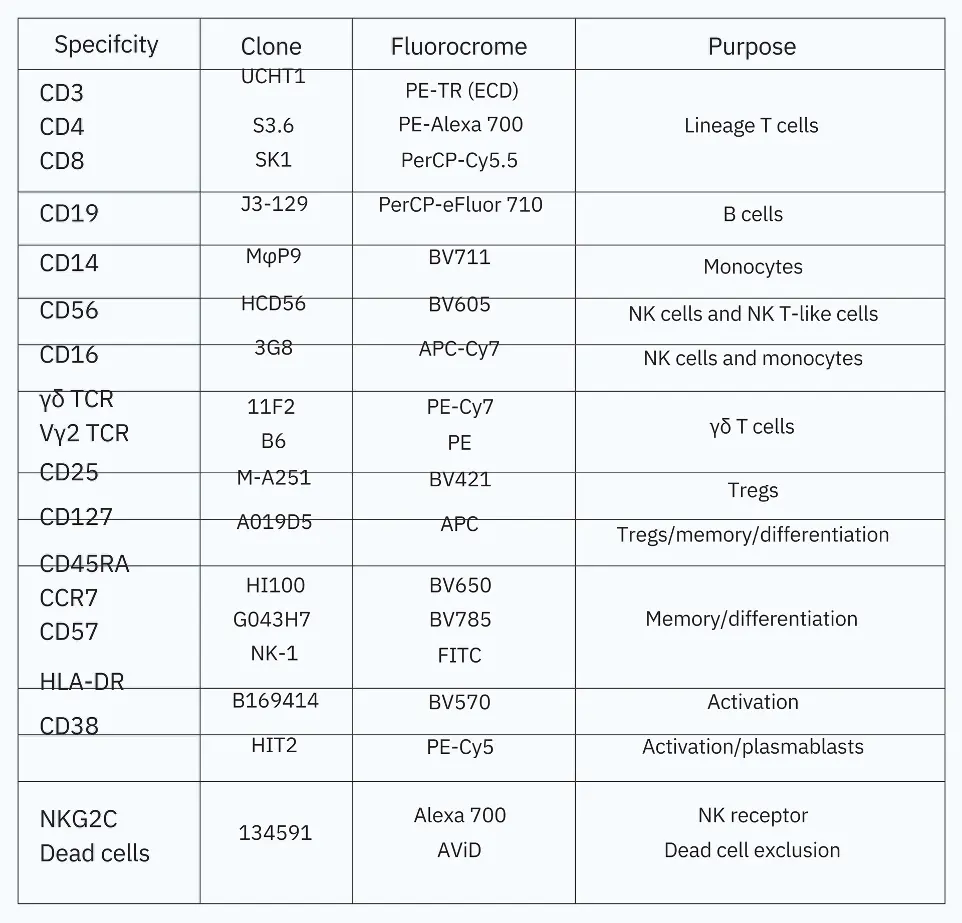
Table 1. 18-color pan leukocyte panel antibody table.
Antibody titration for optimization of antibody concentration
Antibody titration is an important step in panel optimization, allowing optimal signal resolution, population identification, and expression level measurements. Adding too little antibody can result in dim signal and inadequate separation of the positive cells from the negative cells; however, too much antibody increases nonspecific binding, and the spread and background of the negative population.
To titrate an antibody, a single stain was performed at multiple concentrations to
determine which concentration resulted in the best stain index. The stain index is the ratio of the separation between the positive population and negative population divided by two times the standard deviation of the negative population (Figure 1A). The stain index can automatically be determined in the statistics table functions in NovoExpress software. Antibody titrations were performed for all 17 antibodies used in this immunophenotyping panel. This included six 2-fold dilutions of each
antibody starting with the manufacturer's recommended concentration. Figure 1B shows two example plots of antibody titration results. After obtaining the optimized antibody concentration for all 17 colors determined by the highest stain index, the final stain was performed.
In-depth analysis of T and NK lymphocyte activation and differentiation of PBMCs
The panel in Figure 2 was originally designed to evaluate the immune response to a malaria vaccine where NK and γδ T cell responses seemed to be especially important. Therefore, it was important to focus on identifying these cell populations. Expression levels of CD56 (neural cell adhesion molecule NCAM) and CD16 (Fcγ IIIa) were used to define five NK subsets; Vδ2 and γδ TCR were included to identify γδ T cells (Figure 2). As the original OMIP 024 authors described, one to three different populations of γδ T cells can be detected based on the expression levels of Vδ2 TCR. This may indicate functional differences as they show different
profiles of CD16 and CD57, which have been known to correlate with expression of cytotoxic and differentiation markers. NK T cells were identified as CD3+CD56+ cells; NK activation was determined by NKG2C staining. Regulatory T cells were identified by the expression of CD25 (IL-2Rα-chain) and CD127 (IL-7Rα-chain) on CD4+ T cells to avoid intracellular staining for Foxp3. In depth analysis of T cell subsets were achieved by CD45RA and CCR7 costaining to identify the following T cell populations: naΪve (CD45RA+CCR7+), central memory (CD45RA-CCR7+), effector memory (CD45RA-CCR7-), and terminal effector memory (CD45RA+CCR7-).
Further T cell subset analysis was performed by examining the expression
of CD127 (homeostatic proliferation) and CD57 (cell senescence). CD38 and HLA-DR were included to evaluate T cell activation as well as identify plasmablasts (CD19+CD38hi). Dendritic cells were identified as negative for all lineage markers but positive for HLA-DR. This panel allows simultaneous analysis of various leukocyte subsets and granted a comprehensive overview of the immune status.

Figure 1. Antibody titration for an 18-color panel. (A) graphic representation and equation for determination of stain index. (B) representative plots of antibody titrations at six dilutions of antibody for anti-CD4 PE-Alexafluor700 and anti-CCR7 BV785. PBMCs were stained with six serial dilutions of antibody starting with the manufacturer's recommended concentration. All six dilutions are shown on the same plot with the X-axis as the volume (µL) of each antibody added to 50 µL of PBMCs. The red box highlights the optimal concentration for staining.
